使用 Python 和 Matplotlib 在文字中繪製字符
- 王林轉載
- 2023-04-29 19:31:051007瀏覽
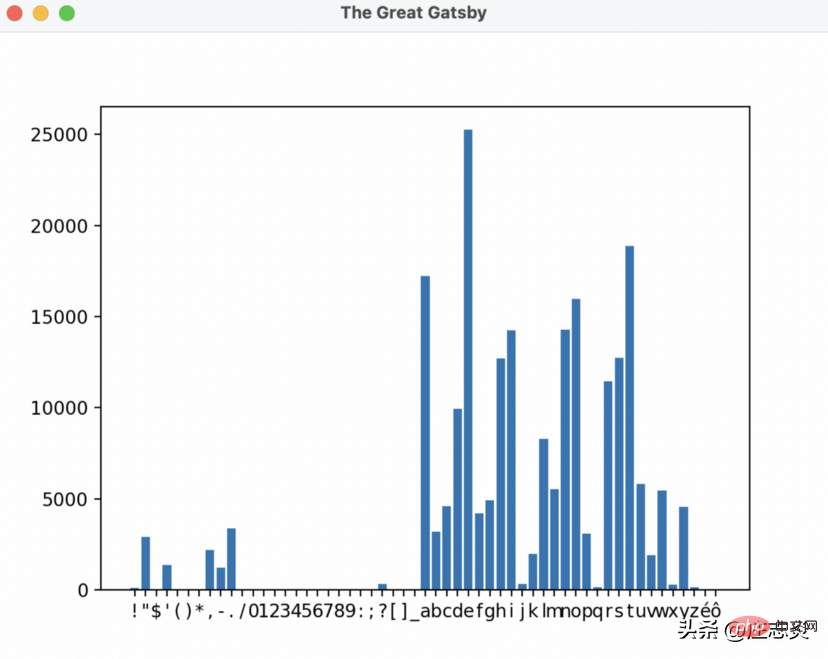
本文的目的是幫助您開始在 python 中繪製資料。我們將創建一個條形圖來繪製給定文字檔案中字元的頻率。在這種情況下,文字檔包含了《了不起的蓋茨比》的內容。

第 1 步:建立您的虛擬環境
這個專案的環境會比較小。虛擬環境可讓您為工作區添加額外的功能,而不會影響電腦的其餘部分!
建立一個目錄並在程式碼編輯器和終端機(執行命令的地方)中開啟它。
讓我們運行:
$ python3 -m venv venv
$ source venv/bin/activate
我們可以安裝我們必要的依賴項
$ pip3 install matplotlib
我們還要建立兩個文件,read.txt 和wordcount.py。
我們將使用 wordcount.py 來分析 read.txt 中的文字。
第2 步:閱讀文字
我們可以比較簡單的開始,
import matplotlib.pyplot as plt # plot
from collections import OrderedDict # this will be used for sorting later

file = open('read.txt')
text = file.read()
file.close()- 首先,它會匯入我們的繪圖和排序庫
- 其次,我們使用內建的open 函數,它允許我們打開一個檔案進行讀寫
- 然後我們讀取檔案裡面的文字並將其儲存到文字變數中
- 最後,我們關閉文件,因為我們不再使用它了
這就是我們「讀取」文件並將內容儲存在變數中所需的全部內容。
第 3 步:分析字元
我們可以追蹤字元的最佳方法是使用 python 字典(在其他程式語言中稱為 hashmap)。
字典是一種非常有用的資料儲存方式。就像真正的字典一樣,它會有一個“單字”列表,您可以查看單字以查看定義。
在程式設計中,這個概念被推廣到「鍵/值」對。這意味著我們可以設定字典,當我向字典詢問“a”時,它將返回“a”出現的總次數。
所以讓我們來編碼吧!
charDict = {} # dictionaries are defined by curly braces
def count_letter(character):
character = character.lower()
if character.isspace():
return
if character in charDict:
charDict[character] = charDict[character] + 1
else:
charDict[character] = 1

# loop through text
for i in text:
count_letter(i)

charDict = OrderedDict(sorted(charDict.items()))
讓我們回顧一下這裡發生了什麼。
- 首先我們定義一個空字典
- 接下來我們使用 def 關鍵字定義一個函數。這個函數接受一個變數“字元”,檢查它是否是一個空格(空格、製表符、換行符)。您可以為您的選擇添加其他標準,例如 isalpha() 以確定字元是否為字母
- 然後檢查它是否已經在字典中。如果它在字典中,它會將值更改為先前的值加1(因為我們正在計算這個字元),否則它將在字典中添加初始計數為1 的新條目
- 然後我們遍歷文字變數中的每個字符,其中“i”代表一個單獨的字符,我們保存並運行我們的函數來計算它們
- 最後,我們使用OrderdedDict 導入按字母順序對字典進行排序
第4步:畫出來!
現在我們的資料集已創建,讓我們將其組織成軸並繪製它!
我們將建立一個清單來表示每個軸
num_list = []
char_list = []
這些清單將相互對應,因此如果char_list 中的第1 項是“a”,則num_list 中的第1 項將是對應的頻率。讓我們也把它編碼出來。
char_list = [] # character
num_list = [] # frequency
# create x and y axes
for x,y in charDict.items():
char_list.append(x)
num_list.append(y)
我們使用兩個變數循環遍歷我們創建的字典中的鍵/值對,然後將它們添加到我們的資料列表中。
最後讓我們使用 matplotlib 建立並儲存這個長條圖。
fig = plt.figure() # create a new figure
ax = fig.add_subplot() # create a new bar graph within the figure
fig.canvas.manager.set_window_title('The Great Gatsby') # title of window
ax.bar(char_list, num_list) # add the data to the graph
plt.savefig('chars.png') # download an image of the bar graph
plt.show() # show the image- 首先,我們建立一個新圖形。圖為整體視窗
- 向圖中新增繪圖
- 使用我們選擇的資料新增條形圖
- 下載圖片
- 顯示影像
##是時候測試它了!
使用下面的程式碼運行您的文件,為我們的結果做好準備! 
$ python3 wordcount.py#######
所以要回答我在文章開頭提出的問題,字母 e 在《了不起的蓋茨比》中被使用了超過 25,000 次!哇!
結論
在本文結束時,我希望您對 matplotlib 和資料科學有所了解。
以上是使用 Python 和 Matplotlib 在文字中繪製字符的詳細內容。更多資訊請關注PHP中文網其他相關文章!

