


react專案增加echarts餅圖的方法:1、透過「npm install echarts --save」指令安裝「echarts」;2、使用import引入「echarts/lib/echarts」;3、透過「componentDidMount () {...}”實現增加echarts餅圖即可。

本教學操作環境:Windows10系統、react18.0.0版、Dell G3電腦。
react專案怎麼增加echarts餅圖?
一、安裝
npm install echarts --save
二、引入
import echarts from 'echarts/lib/echarts';
import  'echarts/lib/chart/pie';  //饼状图
import  'echarts/lib/component/tooltip';
import  'echarts/lib/component/title';
import  'echarts/lib/component/legend'
import  'echarts/lib/component/markPoint'
三、使用
componentDidMount() {
        //环形图百分比
        var huan_val = document.getElementsByClassName("huan")[0];
        var chart = echarts.init(huan_val);
        let option = {
            color: ["#f8e367", "#99dfff", "#58c0f0", "#5ea6ff", "#ff9e48", "#bcbcbc"],
            series: [{
                name: "驾驶分析",
                type: "pie",
                radius: ['60%', '80%'],
                avoidLabelOverlap: false,
                label: {
                    normal: {
                        show: false,
                        position: 'center'
                    },
                    emphasis: {
                        show: true,
                        textStyle: {
                            fontSize: '30',
                            fontWeight: 'bold'
                        }
                    }
                },
                labelLine: {
                    normal: {
                        show: false
                    }
                },
                data: [{
                    value: 33,
                    name: '慢速'
                }, {
                    value: 26,
                    name: '低速'
                }, {
                    value: 6,
                    name: '中速'
                }, {
                    value: 2,
                    name: '高速'
                }, {
                    value: 3,
                    name: '超速'
                }, {
                    value: 30,
                    name: '怠速'
                }]
            }]
        };
        chart.setOption(option);
    }
render(){
return(
<div></div>
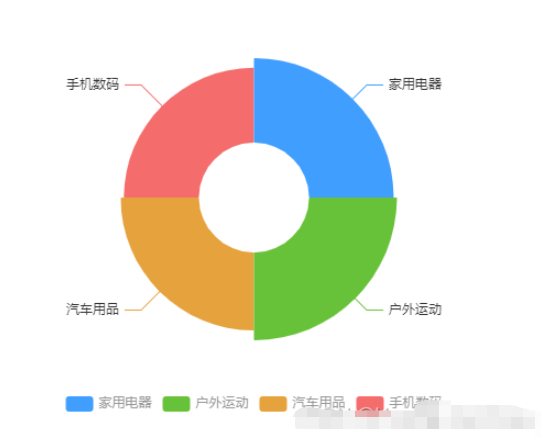
)} 四、結果
推薦學習:《react影片教學》
以上是react專案怎麼增加echarts餅圖的詳細內容。更多資訊請關注PHP中文網其他相關文章!

 ECharts和Java接口:如何实现统计图表数据导出与分享Dec 17, 2023 am 08:44 AM
ECharts是一款功能强大、灵活可定制的开源图表库,可用于数据可视化和大屏展示。在大数据时代,统计图表的数据导出和分享功能变得越来越重要。本文将介绍如何通过Java接口实现ECharts的统计图表数据导出和分享功能,并提供具体的代码示例。一、ECharts简介ECharts是百度开源的一款基于JavaScript和Canvas的数据可视化库,具有丰富的图表
 使用PHP和ECharts创建可视化图表和报表May 10, 2023 pm 10:21 PM
随着大数据时代的来临,数据可视化成为企业决策的重要工具。千奇百怪的数据可视化工具层出不穷,其中ECharts以其强大的功能和良好的用户体验受到了广泛的关注和应用。而PHP作为一种主流的服务器端语言,也提供了丰富的数据处理和图表展示功能。本文将介绍如何使用PHP和ECharts创建可视化图表和报表。ECharts简介ECharts是一个开源的可视化图表库,它由
 ECharts入门指南:如何使用EChartsDec 17, 2023 am 09:26 AM
ECharts入门指南:如何使用ECharts,需要具体代码示例ECharts是一款基于JavaScript的数据可视化库,通过使用ECharts,用户可以轻松地展示各种各样的图表,如折线图、柱状图、饼图等等。本文将为您介绍如何使用ECharts,并提供详细的代码示例。安装ECharts要使用ECharts,您首先需要安装它。您可以从ECharts官网htt
 vue3怎么封装ECharts组件May 20, 2023 pm 03:22 PM
一、前言前端开发需要经常使用ECharts图表渲染数据信息,在一个项目中我们经常需要使用多个图表,选择封装ECharts组件复用的方式可以减少代码量,增加开发效率。二、封装ECharts组件为什么要封装组件避免重复的工作量,提升复用性使代码逻辑更加清晰,方便项目的后期维护封装组件可以让使用者不去关心组件的内部实现以及原理,能够使一个团队更好的有层次的去运行封装的ECharts组件实现了以下的功能:使用组件传递ECharts中的option属性手动/自动设置chart尺寸chart自适应宽高动态展
 利用ECharts和Python接口生成漏斗图的步骤Dec 17, 2023 am 10:08 AM
利用ECharts和Python接口生成漏斗图的步骤,需要具体代码示例漏斗图是一种常用的数据可视化工具,可以用于展示数据在不同阶段之间的变化情况。利用ECharts和Python接口,我们可以轻松地生成漂亮的漏斗图。下面,将按照以下步骤介绍如何实现漏斗图的生成,并给出具体的代码示例。步骤一:安装ECharts和Python接口首先,我们需要安装ECharts
 如何在Python中使用ECharts绘制堆叠柱状图Dec 17, 2023 am 09:48 AM
在数据可视化领域,堆叠柱状图是一种常见的可视化方式。它将多个数据系列绘制成一个条形,每个条形由多个子项组成,每个子项对应一个数据系列,在同一坐标系下进行展示。这种图表可以用于比较不同类别或数据系列的总大小、每个类别或数据系列的组成比例等。在Python中,我们可以使用ECharts库来绘制堆叠柱状图,而且该库具有丰富的可定制性和交互性。一、安装和导入ECha
 如何利用ECharts和Python接口绘制箱线图Dec 17, 2023 am 10:03 AM
如何利用ECharts和Python接口绘制箱线图,需要具体代码示例引言:箱线图(Boxplot)是统计学中常用的一种可视化方法,用于显示实数型数据的分布情况,通过绘制数据的五数概括(最小值、下四分位数、中位数、上四分位数和最大值)以及异常值,可以直观地了解数据的偏态、离散程度和异常值情况。本文将介绍如何利用ECharts和Python接口来绘制箱线图,并
 ECharts是什么Aug 04, 2023 am 10:24 AM
ECharts是基于JavaScript的开源可视化库,能够帮助开发者轻松地实现各种复杂的数据可视化效果,提供了丰富的图表类型和交互功能,同时还具有定制性强、适配移动端和社区支持等诸多优势,无论是在商业应用、数据分析还是数据展示方面,ECharts都是一个非常值得推荐的工具。


熱AI工具

Undresser.AI Undress
人工智慧驅動的應用程序,用於創建逼真的裸體照片

AI Clothes Remover
用於從照片中去除衣服的線上人工智慧工具。

Undress AI Tool
免費脫衣圖片

Clothoff.io
AI脫衣器

AI Hentai Generator
免費產生 AI 無盡。

熱門文章
熱工具

禪工作室 13.0.1
強大的PHP整合開發環境

SublimeText3漢化版
中文版,非常好用

SublimeText3 Linux新版
SublimeText3 Linux最新版

記事本++7.3.1
好用且免費的程式碼編輯器

Dreamweaver CS6
視覺化網頁開發工具

