
PHP7下如何安裝並使用xhprof效能分析工具

- 醉折花枝作酒筹轉載
- 2021-05-27 09:24:082512瀏覽
本篇文章為大家介紹一下PHP7下安裝並使用xhprof效能分析工具的方法。有一定的參考價值,有需要的朋友可以參考一下,希望對大家有幫助。

該xhprof 版本是從https://github.com/longxinH/xhprof 取得
git clone https://github.com/longxinH/xhprof
安裝xhprof
cd xhprof/extension/
phpize
./configure
make
make install
然後在/etc/php.ini根據情況加入
extension=xhprof.so
執行
php -m | grep xhprof
可以看見輸出,說明php擴充安裝成功,然後重啟Apache或php-fpm
#運行
可以直接運行從github上clone下來的文件裡面example目錄下的那個例子
#輸出如下
Array
(
    [main()] => Array
        (
            [ct] => 1
            [wt] => 9
        )

)
---------------
Assuming you have set up the http based UI for
XHProf at some address, you can view run at
http://<xhprof-ui-address>/index.php?run=592567308784c&source=xhprof_foo
---------------
然後複製index.php後面的?run=592567308784c&source=xhprof_foo
訪問
xhprof_html/index.php?run=592567308784c&source=xhprof_foo
可看見輸出
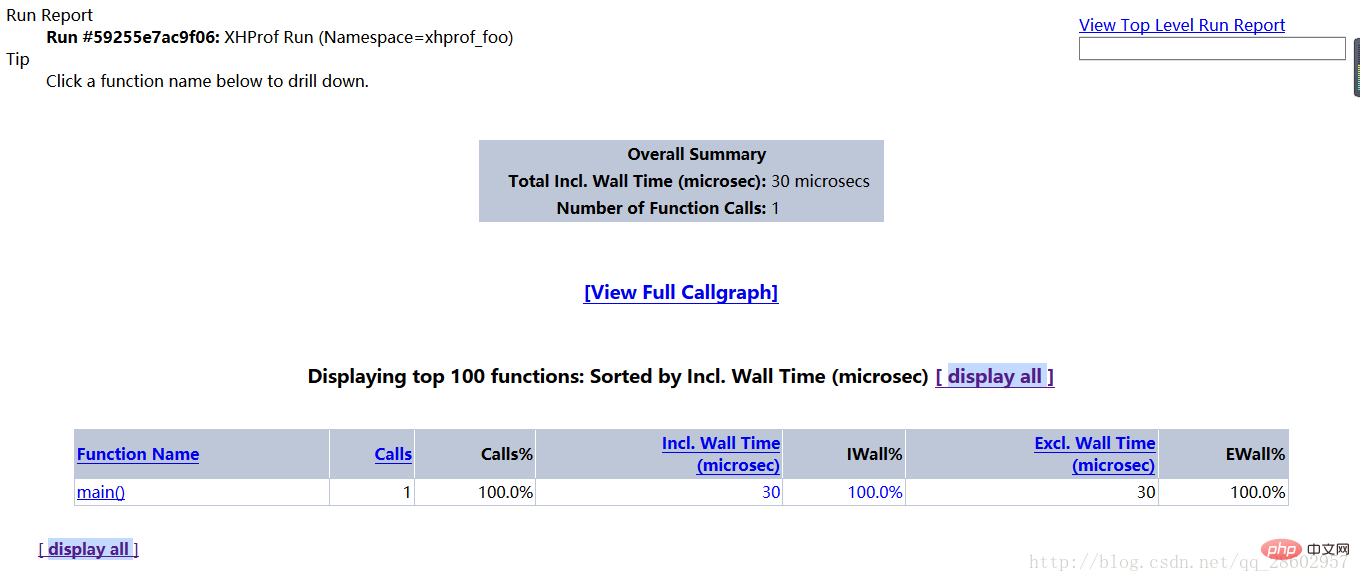
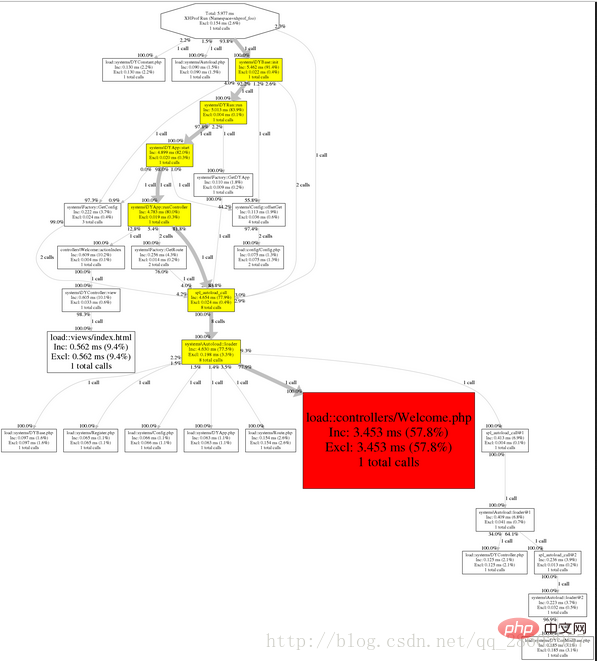
#點擊中間的View Full Callgraph 即可看見效能分析圖片
報錯
failed to execute cmd:" dot -Tpng". stderr:sh: dot:command not found。
//解决方案
yum install graphviz
隨機應變
例如想測試自己的項目,例如一款框架的效能分析。
複製xhprof_lib/utils/下的兩個檔案
xhprof_lib.php和xhprof_runs.php到入口檔案同級目錄,然後在入口檔案起始位置新增
// start profiling
xhprof_enable();
結束位置添加
// stop profiler
$xhprof_data = xhprof_disable();

// display raw xhprof data for the profiler run
print_r($xhprof_data);


include_once "xhprof_lib.php";
include_once "xhprof_runs.php";

// save raw data for this profiler run using default
// implementation of iXHProfRuns.
$xhprof_runs = new XHProfRuns_Default();

// save the run under a namespace "xhprof_foo"
$run_id = $xhprof_runs->save_run($xhprof_data, "xhprof_foo");

echo "---------------\n".
     "Assuming you have set up the http based UI for \n".
     "XHProf at some address, you can view run at \n".
     "http://<xhprof-ui-address>/index.php?run=$run_id&source=xhprof_foo\n".
     "---------------\n";
即可得到如上所示的那個url,然後再次去訪問
http://***/xhprof_html/index.php?run=*****&source=xhprof_foo
得到如下所示頁面
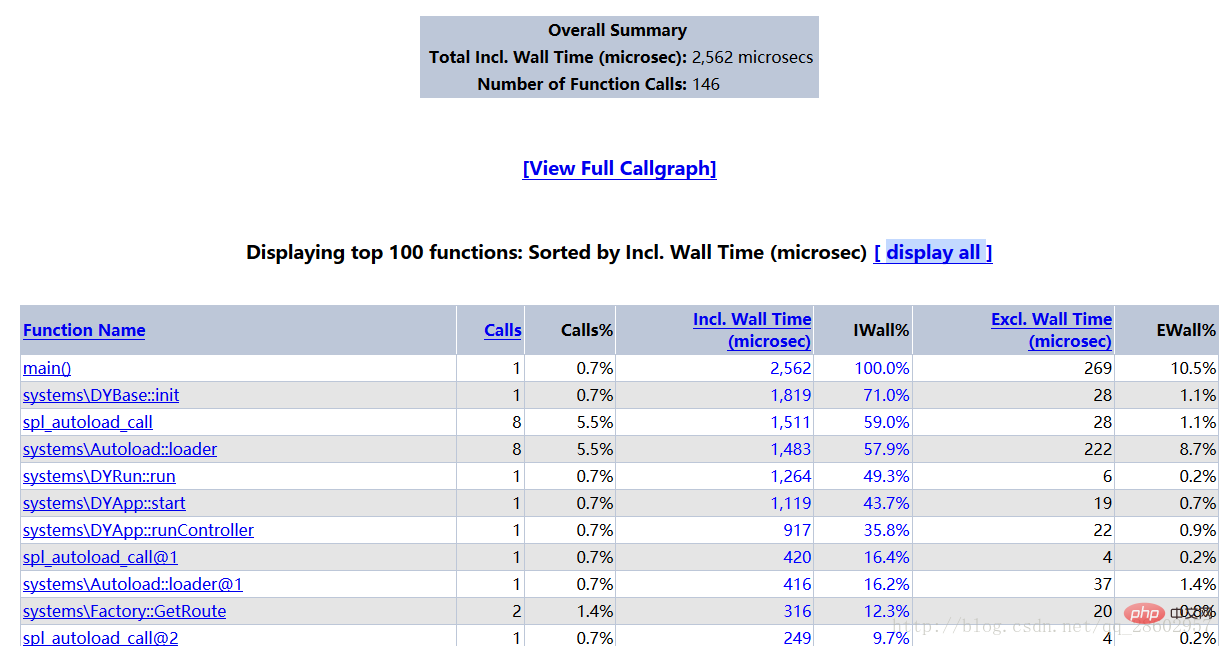
- Function Name:方法名稱。
- Calls:方法被呼叫的次數。
- Calls%:方法呼叫次數在同級方法總數呼叫次數中所佔的百分比。
- Incl.Wall Time(microsec):方法執行所花費的時間,包括子方法的執行時間。 (單位:微秒)
- IWall%:方法執行花費的時間百分比。
- Excl. Wall Time(microsec):方法本身執行所花費的時間,不包含子方法的執行時間。 (單位:微秒)
- EWall%:方法本身執行花費的時間百分比。
- Incl. CPU(microsecs):方法執行所花費的CPU時間,包含子方法的執行時間。 (單位:微秒)
- ICpu%:方法執行花費的CPU時間百分比。
- Excl. CPU(microsec):方法本身執行所花費的CPU時間,不包含子方法的執行時間。 (單位:微秒)
- ECPU%:方法本身執行花費的CPU時間百分比。
- Incl.MemUse(bytes):方法執行佔用的內存,包括子方法執行佔用的記憶體。 (單位:位元組)
- IMemUse%:方法執行所佔用的記憶體百分比。
- Excl.MemUse(bytes):方法本身執行佔用的內存,不包括子方法執行佔用的記憶體。 (單位:位元組)
- EMemUse%:方法本身執行所佔用的記憶體百分比。
- Incl.PeakMemUse(bytes):Incl.MemUse峰值。 (單位:位元組)
- IPeakMemUse%:Incl.MemUse峰值百分比。
- Excl.PeakMemUse(bytes):Excl.MemUse峰值。單位:(位元組)
- EPeakMemUse%:Excl.MemUse峰值百分比。
以上是PHP7下如何安裝並使用xhprof效能分析工具的詳細內容。更多資訊請關注PHP中文網其他相關文章!
陳述:
本文轉載於:csdn.net。如有侵權,請聯絡admin@php.cn刪除
上一篇:PHP7如何能夠連接資料庫下一篇:PHP7如何能夠連接資料庫