
php7如何使用xhprof測試php效能? (方法介紹)

- 青灯夜游轉載
- 2020-07-15 17:11:474918瀏覽
介紹
#1 背景
PHP的xhprof擴充Facebook不再進行更新和維護,因為Faceboo已經全面使用HHVM,不再使用PHP zend引擎。
xhprof不支援新版本的PHP(PHP7),tideways擴充是從xhprof專案fork下來繼續進行維護的,目前支援PHP 7.2, 7.1, 7.0, 5.6 and 5.5 。
tideways是開源項目,它收費的只是UI服務,其實xhgui完全可以滿足我們日常的需求
2 功能
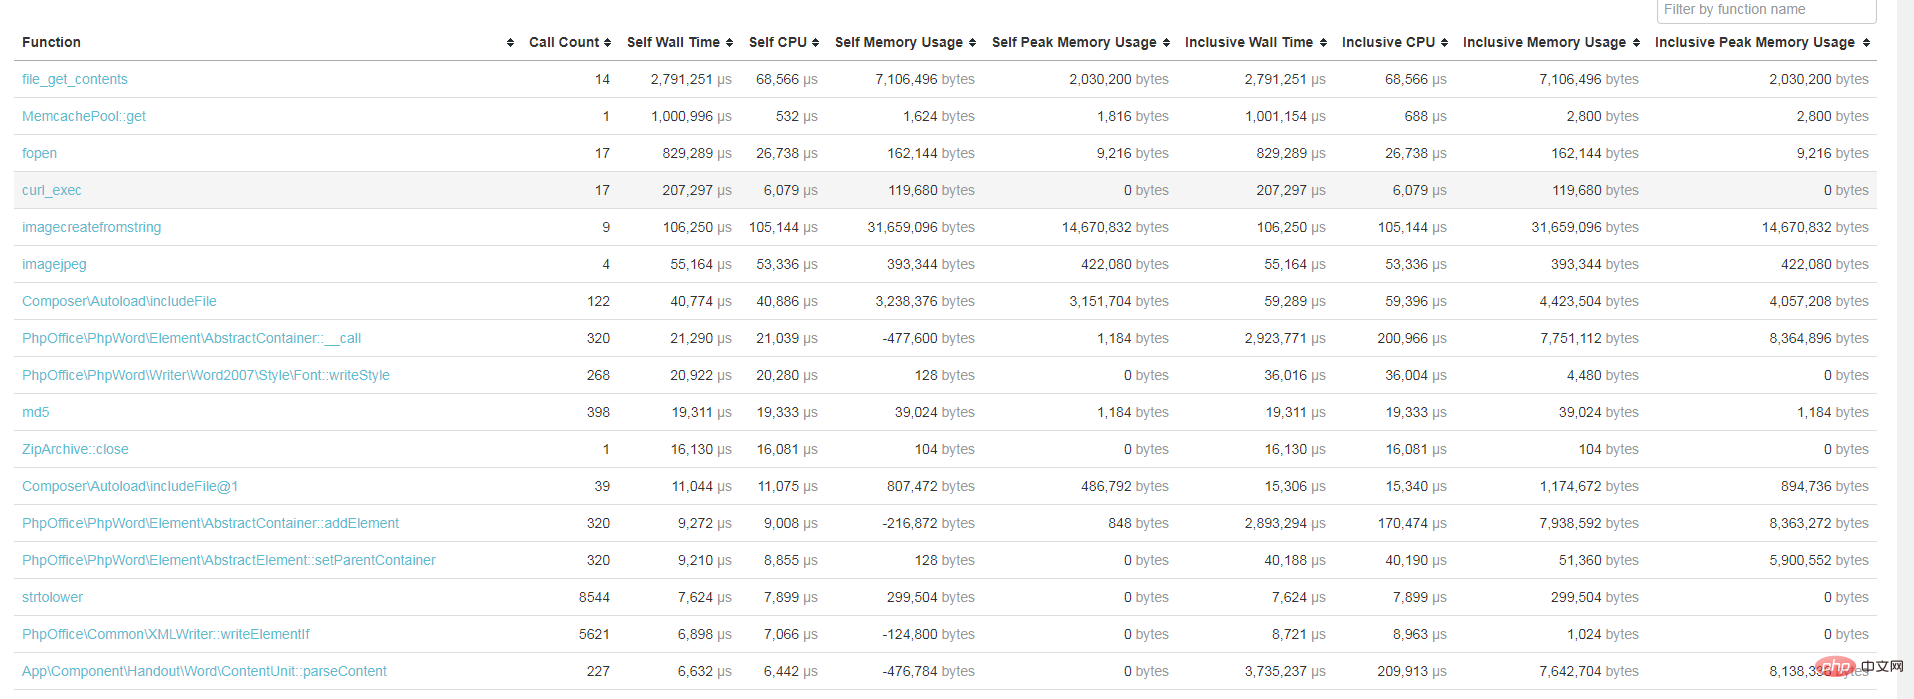
tideways是用來測試PHP效能的擴展,它能取得PHP執行的整個過程中所呼叫的函數、呼叫函數次數、執行時間、CPU時間、記憶體佔用、記憶體峰值、總執行時間、總CPU時間、總記憶體佔用、總記憶體峰值等數據,透過上述數據進行分析,找出PHP的效能瓶頸、分析PHP執行過程等。
3 優點
tideways是一個PHP擴展,結合xhgui,無需在PHP程式碼中進行埋點來監控代碼
可以設定執行頻率(例如1/100),無需每個請求都產生執行日誌,從而導致效能損失;也可以主動控制是否產生執行日誌,透過請求參數來控制(debug=1)
有簡單直接的UI對資料進行轉換
可以自由的搭配條件進行資料篩選,例如分析某個特定的接口,分析某個時間段的接口請求情況等
#4 缺點
雖然是非侵入式的,但是如果對每個介面產生執行日誌,那麼對CPU和記憶體的消耗是不可忽略的。
5 實作原理
- tideways擴充功能負責產生運行日誌
- nginx中透過設定fastcgi_param PHP_VALUE auto_prepend_file,在請求開始之前執行auto_prepend_file配置的PHP文件,文件中利用register_shutdown_function方法,在PHP進程結束的時候調用tideways_disable來實現tideways的嵌入,然後將執行日誌存入mongodb或者mysql或者文件中,通過xhgui分析之後進行展示,展示形式包括長條圖、瀑布流、火焰圖。
應用
接下來介紹兩種應用方式:侵入式和非侵入式
侵入式指的是在程式碼中加入程式碼,侵入式使用的是預設的ui;
非侵入式指的是不對程式碼做任何改動,透過改變nginx/apache實作程式碼注入,非侵入式使用的是xhgui;
安裝tideways_xhprof
git clone "https://github.com/tideways/php-xhprof-extension.git"
cd php-xhprof-extension
phpize
./configure --with-php-config=/usr/local/php7/bin/php-config
make
sudo make install
在php.ini加上extension=tideways_xhprof.so
非侵入式:
<?php
tideways_xhprof_enable();
// your application code
$data = tideways_xhprof_disable();
file_put_contents(
sys_get_temp_dir() . "/" . uniqid() . ".yourapp.xhprof",
serialize($data)
);
// $data = tideways_xhprof_disable();
// file_put_contents(
// sys_get_temp_dir() . "/" . date('His', time()) . ".material.xhprof",
// serialize($data)
// );這裡產生的.xhprof檔案在tmp 目錄下,預設UI也會去tmp目錄下尋找.xhprof檔案
安裝預設UI用來尋找資料
git clone git@github.com:phacility/xhprof.git
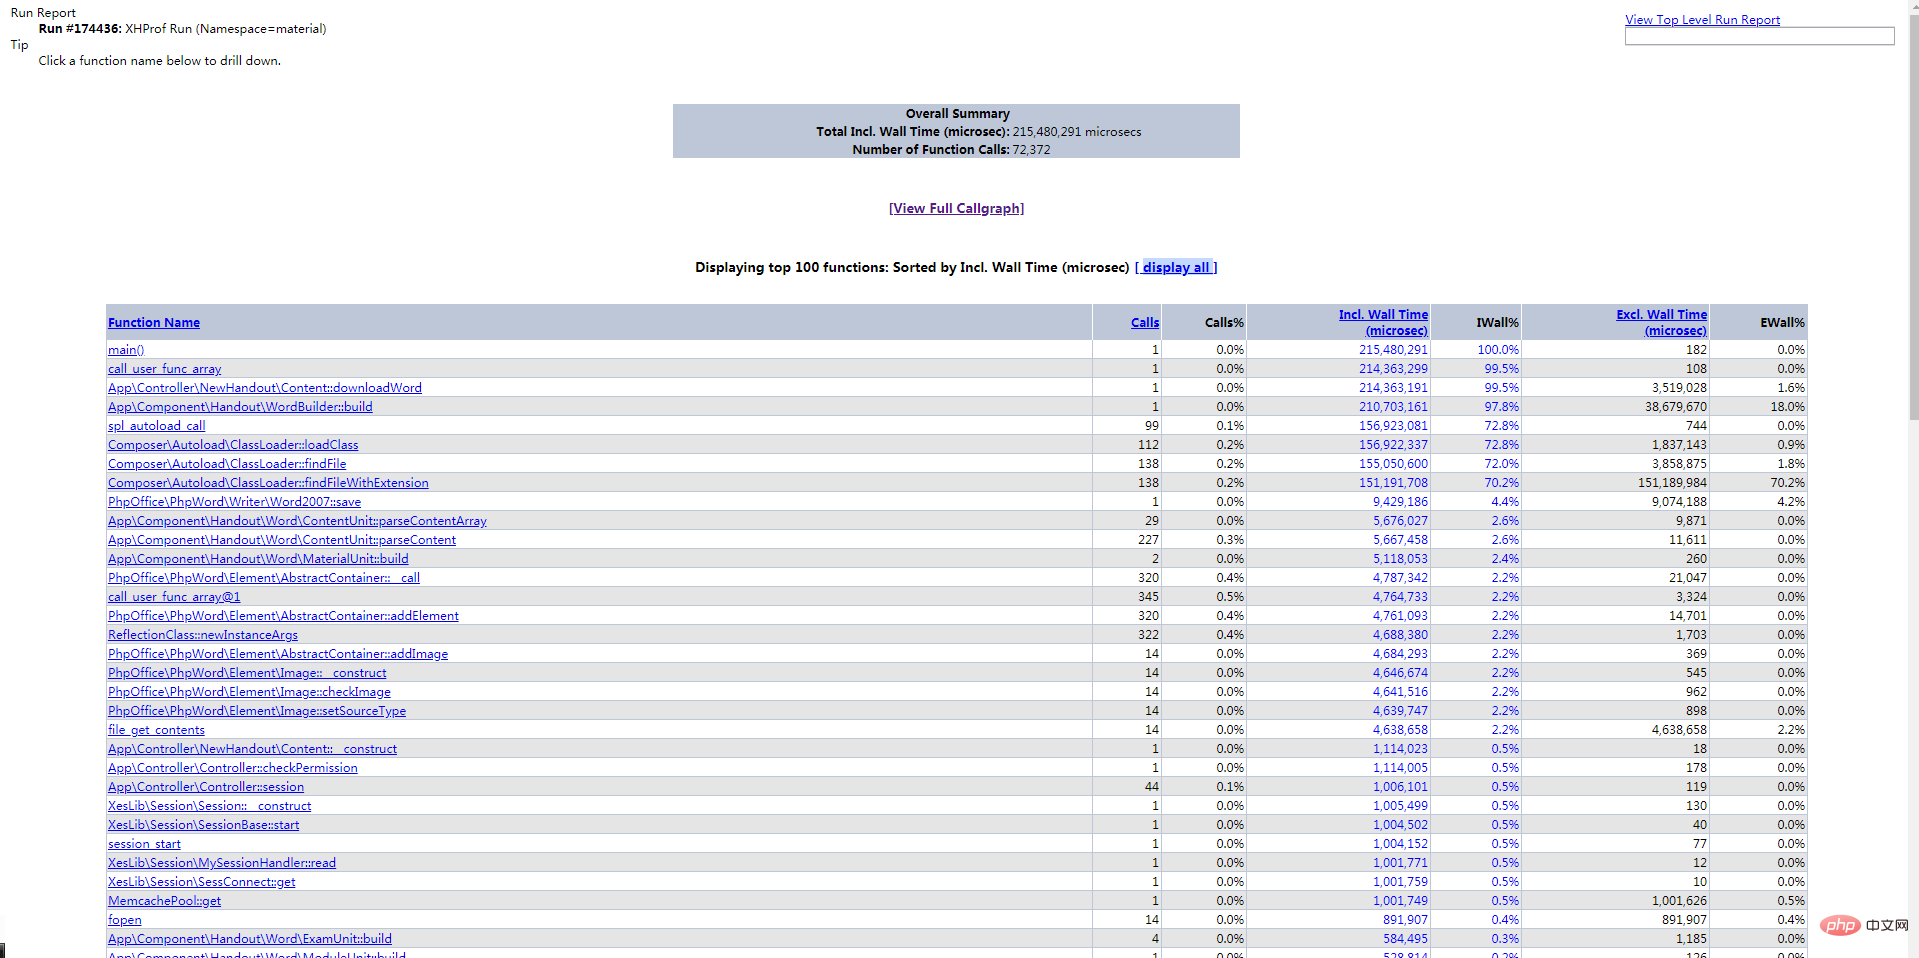
將此儲存庫中的xhprof_lib和 xhprof_html目錄安裝到您的網路資料夾中,並導航xhprof_html/index.php 以查看追蹤清單。
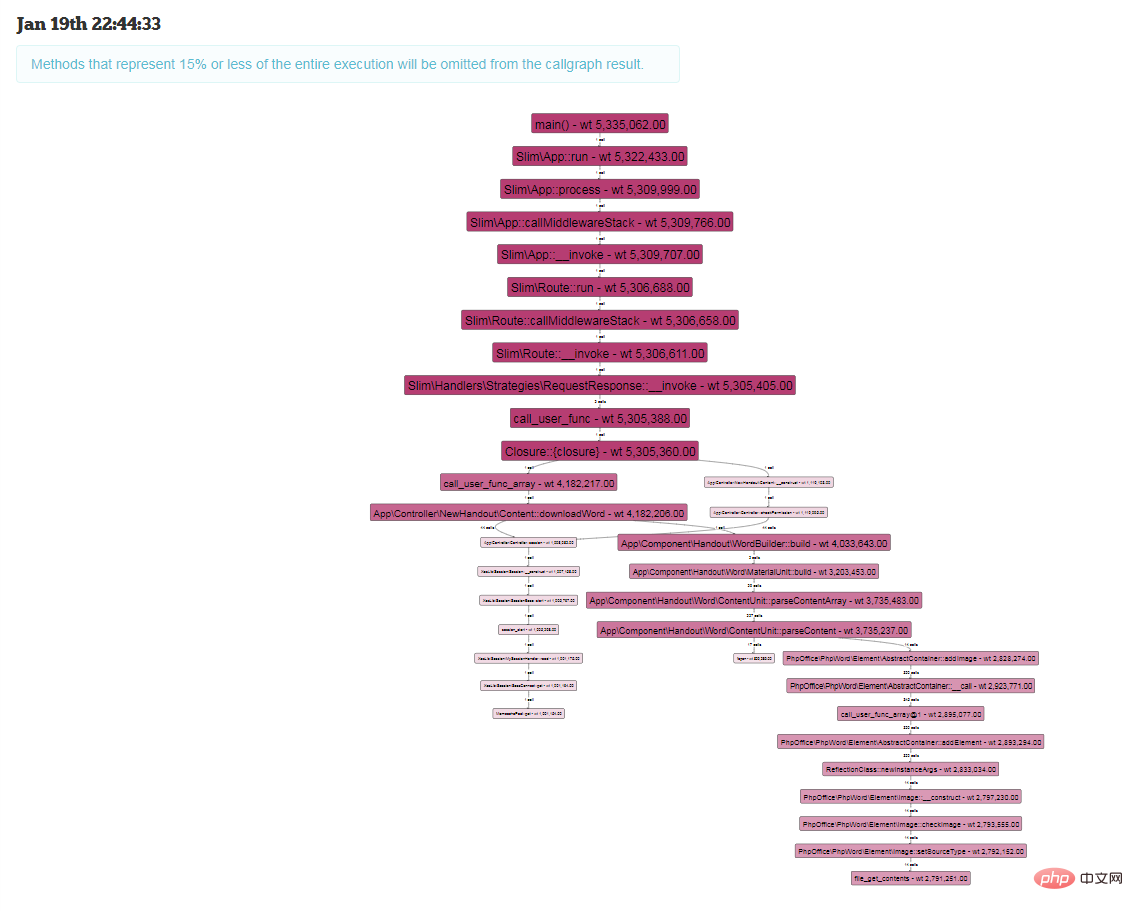
如果想要看函數呼叫筆記需要安裝Callgraph
安裝Callgraph
Callgraph 實際上由三個工具組合而成。
一個是用來產生 C 函數呼叫樹的 cflow 或 calltree,下文主要介紹 cflow。
一個處理 dot 文字圖形語言的工具,由 graphviz 提升。
一個用來把C 函式呼叫樹轉換為dot 格式的腳本:tree2dotx
#以Ubuntu 為例,分別安裝它們:
sudo apt-get install cflow graphviz
接下來安裝tree2dotx 和Callgraph ,這裡都預設安裝到/usr/local/bin。
wget -c https://github.com/tinyclub/linux-0.11-lab/raw/master/tools/tree2dotx
wget -c https://github.com/tinyclub/linux-0.11-lab/raw/master/tools/callgraph
sudo cp tree2dotx callgraph /usr/local/bin
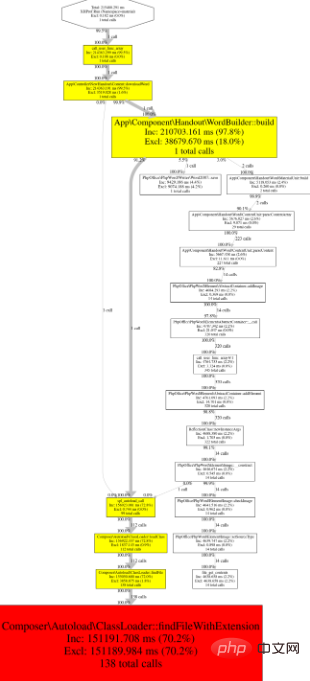
sudo chmod +x /usr/local/bin/{tree2dotx,callgraph}接下來展示兩張效果圖:
##侵入式:
# 侵入式使用的xhgui 需要用到mongodb#安裝xhgui
git clone git@github.com:perftools/xhgui.git
#設定Nginx
server {
  listen 80;
  server_name site.localhost;
  root /Users/markstory/Sites/awesome-thing/app/webroot/;
  fastcgi_param PHP_VALUE "auto_prepend_file=/home/www/xhgui/external/header.php";  #这里依据个人目录而配
}這裡的意思是在執行專案php程式碼前先執行header.php,從而達到非侵入式偵測效能的目的xhgui配置(產生日誌的頻率)
在xhgui的config/config.default.php中,可設定取樣命中次數;return rand(1, 100) === 42; 为1%的采样率,改成return True;则标识每次都采样
'profiler.enable' => function() {
   // url 中包含debug=1则百分百捕获
   if(!empty($_GET['debug'])){
       return True;
   }else{
       // 1%采样
       return rand(1, 100) === 42;
   }
}
mongodb的配置
xhgui/config/config.default.php
// Can be either mongodb or file.
   /*
   'save.handler' => 'file',
   'save.handler.filename' => dirname(__DIR__) . '/cache/' . 'xhgui.data.' . microtime(true) . '_' . substr(md5($url), 0, 6),
   */
   'save.handler' => 'mongodb',
   // Needed for file save handler. Beware of file locking. You can adujst this file path
   // to reduce locking problems (eg uniqid, time ...)
   //'save.handler.filename' => __DIR__.'/../data/xhgui_'.date('Ymd').'.dat',
   'db.host' => 'mongodb://127.0.0.1:27017',
   'db.db' => 'xhprof',
mongo服务器的配置
mongo
 > use xhprof
 > db.results.ensureIndex( { 'meta.SERVER.REQUEST_TIME' : -1 } )
 > db.results.ensureIndex( { 'profile.main().wt' : -1 } )
 > db.results.ensureIndex( { 'profile.main().mu' : -1 } )
 > db.results.ensureIndex( { 'profile.main().cpu' : -1 } )
 > db.results.ensureIndex( { 'meta.url' : 1 } )
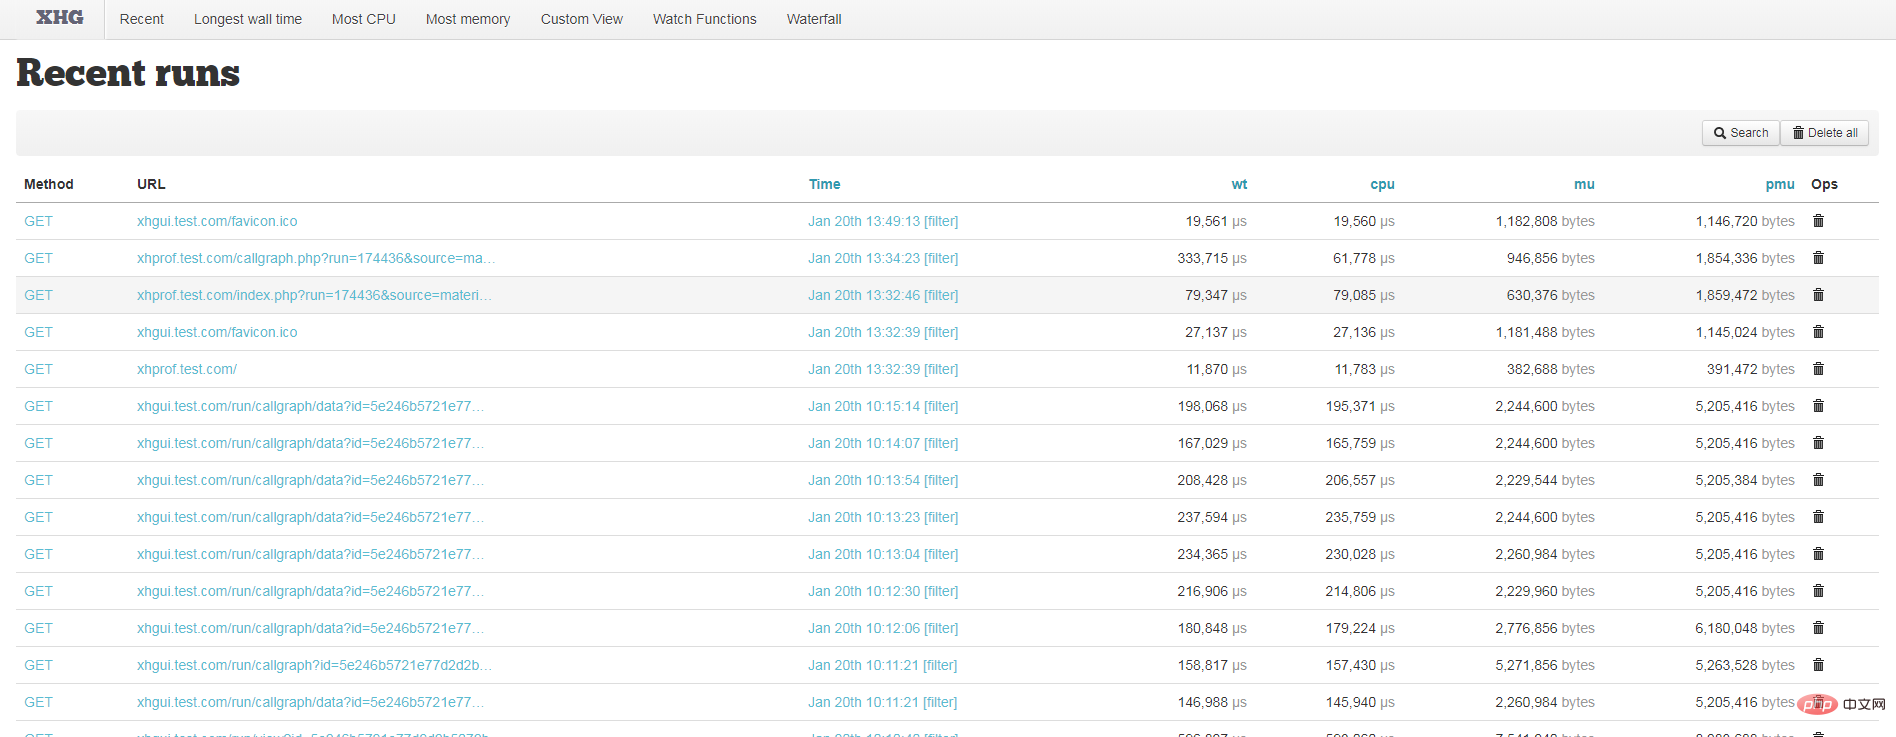
最后展示几张xhgui的效果图
相关学习推荐:PHP编程从入门到精通
以上是php7如何使用xhprof測試php效能? (方法介紹)的詳細內容。更多資訊請關注PHP中文網其他相關文章!