echarts.js的折線圖如何實現? echarts.js折線統計圖的實作程式碼
- 不言原創
- 2018-08-17 10:25:454234瀏覽
這篇文章帶給大家的內容是關於echarts.js的折線圖如何實現? echarts.js折線統計圖的實作程式碼,有一定的參考價值,有需要的朋友可以參考一下,希望對你有幫助。
<!DOCTYPE html PUBLIC "-//W3C//DTD XHTML 1.0 Transitional//EN" "http://www.w3.org/TR/xhtml1/DTD/xhtml1-transitional.dtd">
<html xmlns="http://www.w3.org/1999/xhtml">
<head>
<meta http-equiv="Content-Type" content="text/html; charset=utf-8" />
<title>常用的数据统计图</title>
<link type="text/css" rel="stylesheet" href="./css/index.css" />
<style type="text/css">
body{font-size:14px;color:#000;user-select:none;-webkit-user-select:none;-webkit-text-size-adjust:none;background-color:#fff;}
html,body{height:100%;}
*{font-family:"微软雅黑","华文细黑",Arial,Helvetica,sans-serif;}
a,input,div,textarea{outline:none;}
html,body,h1,h2,h3,h4,h5,h6,p,dl,dd,ol,ul,th,td,form,fieldset,input,button,textarea,a{margin:0;padding:0}
input,textarea,select{text-decoration:none;outline:0 none;resize:none;-webkit-tap-highlight-color:rgba(0,0,0,0);-webkit-appearance:none;border-radius:0;}
ul,dl,ol{list-style:none;}
ul,li{list-style:none;}
fieldset,img{border:0;}
a{text-decoration:none;outline:0 none;}
body{background-color:#faf9f4;}
p{color:#3d3d3d;font-size:20px;text-align:center;padding:100px 0 10px 0;}
#ring,#line,#pillar1,#pillar2{margin:0 auto;}
.null{padding-bottom:100px;}
</style>
</head>
<body>
<p>折线统计图</p>
<div id="line" style="width:822px;height:492px;"></div>
<div class="null"></div>
<script src="https://cdn.bootcss.com/jquery/3.3.1/jquery.min.js"></script>
<script src="https://cdn.bootcss.com/echarts/4.1.0.rc2/echarts.min.js"></script>
<!-- <script type="text/javascript" src="./js/jquery-1.7.2-min.js"></script>
<script type="text/javascript" src="./js/echarts.min.js"></script> -->
<script type="text/javascript">
// JavaScript Document
// echarts
// create for AgnesXu at 20161115
//折线图
var line = echarts.init(document.getElementById('line'));
line.setOption({
color:["#32d2c9"],
title: {
x: 'left',
text: '成绩统计',
textStyle: {
fontSize: '18',
color: '#4c4c4c',
fontWeight: 'bolder'
}
},
tooltip: {
trigger: 'axis'
},
toolbox: {
show: true,
orient: 'horizontal',
feature: {
dataZoom: {
yAxisIndex: 'none'
},
dataView: {readOnly: false},
magicType: {type: ['line', 'bar']}
}
},
xAxis: {
type: 'category',
boundaryGap: false,
data: ['周一','周二','周三','周四','周五','周六','周日'],
axisLabel: {
interval:0
}
},
yAxis: {
show: false,
type: 'value',
axisLabel: {
formatter: '{value} °C'
}
},
series: [
{
name:'成绩',
type:'line',
data:[23, 42, 18, 45, 48, 49,100],
markLine: {data: [{type: 'average', name: '平均值'}]}
}
]
}) ;
</script>
</body>
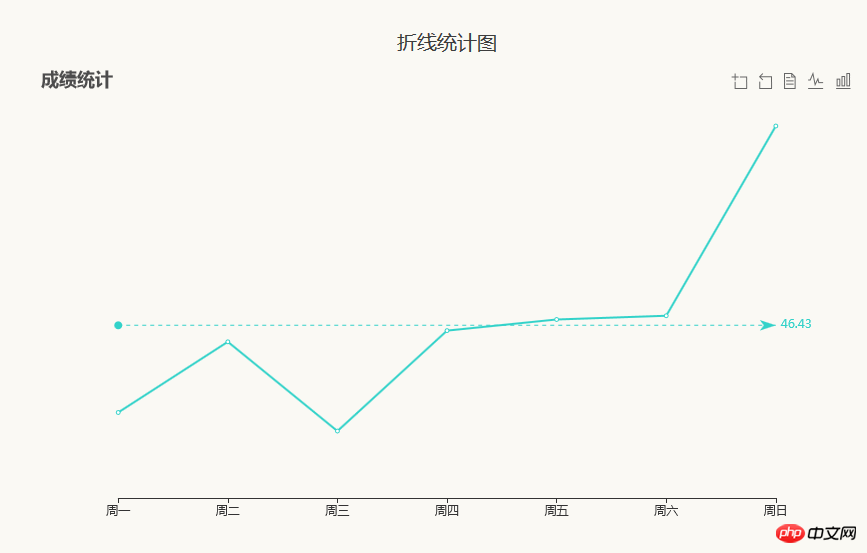
</html>運行結果如下:

相關推薦:
JQplot的折線圖 圖示_html/css_WEB-ITnose
以上是echarts.js的折線圖如何實現? echarts.js折線統計圖的實作程式碼的詳細內容。更多資訊請關注PHP中文網其他相關文章!
陳述:
本文內容由網友自願投稿,版權歸原作者所有。本站不承擔相應的法律責任。如發現涉嫌抄襲或侵權的內容,請聯絡admin@php.cn

