
Python使用pylab庫實作繪製直方圖功能

- 不言原創
- 2018-06-02 14:54:532263瀏覽
這篇文章主要介紹了Python使用pylab庫實現繪製直方圖功能,結合實例形式分析了Python數據讀取、遍歷以及基於pylab庫繪製直方圖的相關操作技巧,需要的朋友可以參考下
本文實例講述了Python使用pylab庫實作繪製直方圖功能。分享給大家供大家參考,具體如下:
Python直方圖
#!/usr/bin/python
# -*- coding: utf-8 -*-
import pylab as pl
dataFile = "dataList.txt"
tempList = []
with open(dataFile,"r") as data:
for everLine in data:
arrEverLine = [float(index) for index in everLine.split()]
tempList.append(arrEverLine[0])
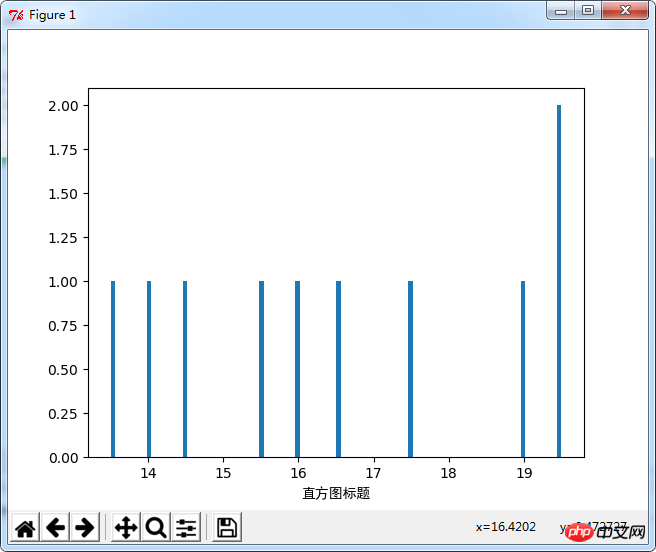
pl.hist(tempList,100)
pl.xlabel("直方图标题", fontproperties='SimHei')
pl.show()dataList.txt內容
14 2 1 0.5 0.5 0 1 0.5 1.5 18.5
19 2 2 0.5 1 0 1 0.5 0 21
19.5 2 1.5 2 0 0.5 2 0 1 20
17.5 1.5 1 1.5 2 0 1.5 0 0 18.5
19.5 2 2 2 0.5 0 1 0 0.5 19.5
16.5 2 0.5 1 0 0.5 0.5 0 0.5 19.5
15.5 2 1 1.5 0 0 1 0.5 1 17.5
13.5 1.5 1 1 2 0 2 0.5 2 20
14.5 2 1.5 2 0 0 1 0 2 18.5
16 2 2 1.5 1 0.5 1 0 2 19.5
。。。
輸出結果
以上是Python使用pylab庫實作繪製直方圖功能的詳細內容。更多資訊請關注PHP中文網其他相關文章!
陳述:
本文內容由網友自願投稿,版權歸原作者所有。本站不承擔相應的法律責任。如發現涉嫌抄襲或侵權的內容,請聯絡admin@php.cn