Chart.js 輕量級HTML5圖表繪製工具庫使用詳解
- php中世界最好的语言原創
- 2018-05-28 11:08:223089瀏覽
這次帶給大家Chart.js 輕量級HTML5圖表繪製工具庫使用詳解,Chart.js 輕量級HTML5圖表繪製工具庫使用的注意事項有哪些,以下就是實戰案例,一起來看一下。
步驟:
html部分:
<canvas id="myChart" width="400" height="400"></canvas>
javascript部分:
- ##引入Chart.js文件;
- 建立圖表:實例化Chart物件(取得DOM節點取得2d context環境後實例化);
- 實例化Chart物件後就繼續建立具體類型的圖表了;
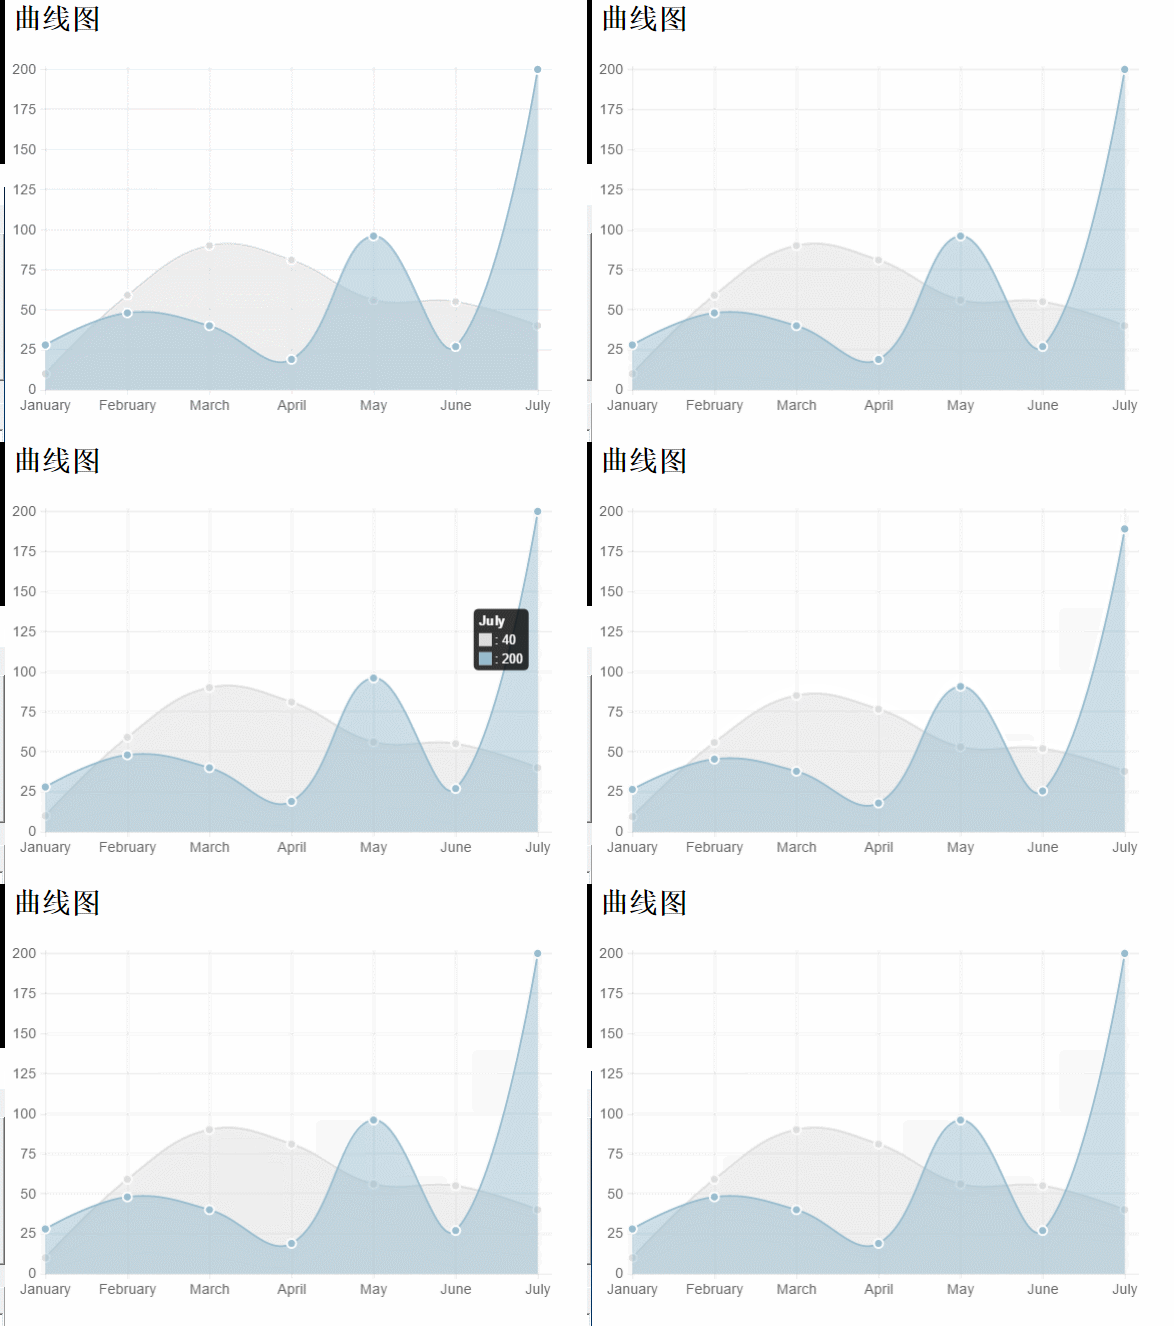
曲線圖(Line chart):
html:<canvas id="myChart" width="600" height="400"></canvas>javascript:(引入及兩種使用方式)
<script src="js/Chart.min.js"></script>
<script type="text/javascript">
 //方式一:
 var ctx = document.getElementById("myChart").getContext("2d");;
 var MyNewChart = new Chart(ctx).Line(data); //这种方式是只加载数据集,(缺省options)不修改默认参数(简称法一)
 //数据结构(数据参数设置)
 var data = {
 //折线图需要为每个数据点设置一标签。这是显示在X轴上。
 labels: ["January", "February", "March", "April", "May", "June", "July"],
 //数据集(y轴数据范围随数据集合中的data中的最大或最小数据而动态改变的)
 datasets: [{
   fillColor: "rgba(220,220,220,0.5)", //背景填充色
   strokeColor: "rgba(220,220,220,1)", //路径颜色
   pointColor: "rgba(220,220,220,1)", //数据点颜色
   pointStrokeColor: "#fff", //数据点边框颜色
   data: [10, 59, 90, 81, 56, 55, 40] //对象数据
  }, {
   fillColor: "rgba(151,187,205,0.5)",
   strokeColor: "rgba(151,187,205,1)",
   pointColor: "rgba(151,187,205,1)",
   pointStrokeColor: "#fff",
   data: [28, 48, 40, 19, 96, 27, 200]
  }]
  };
</script>
資料結構:
//数据结构(数据参数设置)
 var data = {
 //折线图需要为每个数据点设置一标签。这是显示在X轴上。
 labels: ["January", "February", "March", "April", "May", "June", "July"],
 //数据集(y轴数据范围随数据集合中的data中的最大或最小数据而动态改变的)
 datasets: [{
   fillColor: "rgba(220,220,220,0.5)", //背景填充色
   strokeColor: "rgba(220,220,220,1)", //路径颜色
   pointColor: "rgba(220,220,220,1)", //数据点颜色
   pointStrokeColor: "#fff", //数据点边框颜色
   data: [10, 59, 90, 81, 56, 55, 40] //对象数据
  }, {
   fillColor: "rgba(151,187,205,0.5)",
   strokeColor: "rgba(151,187,205,1)",
   pointColor: "rgba(151,187,205,1)",
   pointStrokeColor: "#fff",
   data: [28, 48, 40, 19, 96, 27, 200]
  }]
  };
圖示參數:
Line.defaults = {
  //网格线是否在数据线的上面
  scaleOverlay : false,
  //是否用硬编码重写y轴网格线
  scaleOverride : false,
  //** Required if scaleOverride is true **
  //y轴刻度的个数
  scaleSteps : null,
  //y轴每个刻度的宽度
  scaleStepWidth : 20,
  // Y 轴的起始值
  scaleStartValue : null,
  // Y/X轴的颜色
  scaleLineColor: "rgba(0,0,0,.1)",
  // X,Y轴的宽度
  scaleLineWidth: 1,
  // 刻度是否显示标签, 即Y轴上是否显示文字
  scaleShowLabels: true,
  // Y轴上的刻度,即文字
  scaleLabel: "<%=value%>",
  // 字体
  scaleFontFamily: "'Arial'",
  // 文字大小
  scaleFontSize: 16,
  // 文字样式
  scaleFontStyle: "normal",
  // 文字颜色
  scaleFontColor: "#666",
  // 是否显示网格
  scaleShowGridLines: true,
  // 网格颜色
  scaleGridLineColor: "rgba(0,0,0,.05)",
  // 网格宽度
  scaleGridLineWidth:2,
  // 是否使用贝塞尔曲线? 即:线条是否弯曲
  bezierCurve: true,
  // 是否显示点数
  pointDot: true,
  // 圆点的大小
  pointDotRadius:5,
  // 圆点的笔触宽度, 即:圆点外层白色大小
  pointDotStrokeWidth: 2,
  // 数据集行程(连线路径)
  datasetStroke: true,
  // 线条的宽度, 即:数据集
  datasetStrokeWidth: 2,
  // 是否填充数据集
  datasetFill: true,
  // 是否执行动画
  animation: true,
  // 动画的时间
  animationSteps: 60,
  // 动画的特效
  animationEasing: "easeOutQuart",
  // 动画完成时的执行函数
  /*onAnimationComplete: null*/
  }
(表示剛接觸Chart .js,看到這圖表參數整個人都懵了,還全程英文註釋,呵呵~)
#理解完圖表參數後,就可以自訂圖表參數啦,下面來看看具體例子用法:html部分和js檔案引入部分省略:(之後的圖表類型也同樣省略!)<script type="text/javascript">
//同样数据参数设置
var data = {
//折线图需要为每个数据点设置一标签。这是显示在X轴上。
labels: ["January", "February", "March", "April", "May", "June", "July"],
//这边的thisId分别对应labels的id
thisIds : [12,22,50,44,99,3,67],
//数据集(y轴数据范围随数据集合中的data中的最大或最小数据而动态改变的)
datasets: [{
fillColor: "rgba(220,220,220,0.5)", //背景填充色
strokeColor: "rgba(220,220,220,1)", //路径颜色
pointColor: "rgba(220,220,220,1)", //数据点颜色
pointStrokeColor: "#fff", //数据点边框颜色
data: [10, 59, 90, 81, 56, 55, 40] //对象数据
}, {
fillColor: "rgba(151,187,205,0.5)",
strokeColor: "rgba(151,187,205,1)",
pointColor: "rgba(151,187,205,1)",
pointStrokeColor: "#fff",
data: [28, 48, 40, 19, 96, 27, 200]
}]
};
window.onload = function() {
var ctx = document.getElementById("myChart").getContext("2d");;
//方式二:传入对象字面量去修改默认图标参数,自定义图表
var MyNewChart = new Chart(ctx).Line(data, {
// 网格颜色
scaleGridLineColor: "rgba(255,0,0,1)",
// Y/X轴的颜色
scaleLineColor: "rgba(0,0,0,.1)",
// 文字大小
scaleFontSize: 16,
// 文字颜色
scaleFontColor: "#666",
// 网格颜色
scaleGridLineColor: "rgba(0,0,0,.05)",
// 是否使用贝塞尔曲线? 即:线条是否弯曲
// 是否执行动画
animation: true,
// 动画的时间
animationSteps: 60,
// 动画完成时的执行函数
onAnimationComplete: function(){
console.log("给x轴的lable对应的id:");
console.log(data.thisIds);
}
});
}
</script>效果圖:

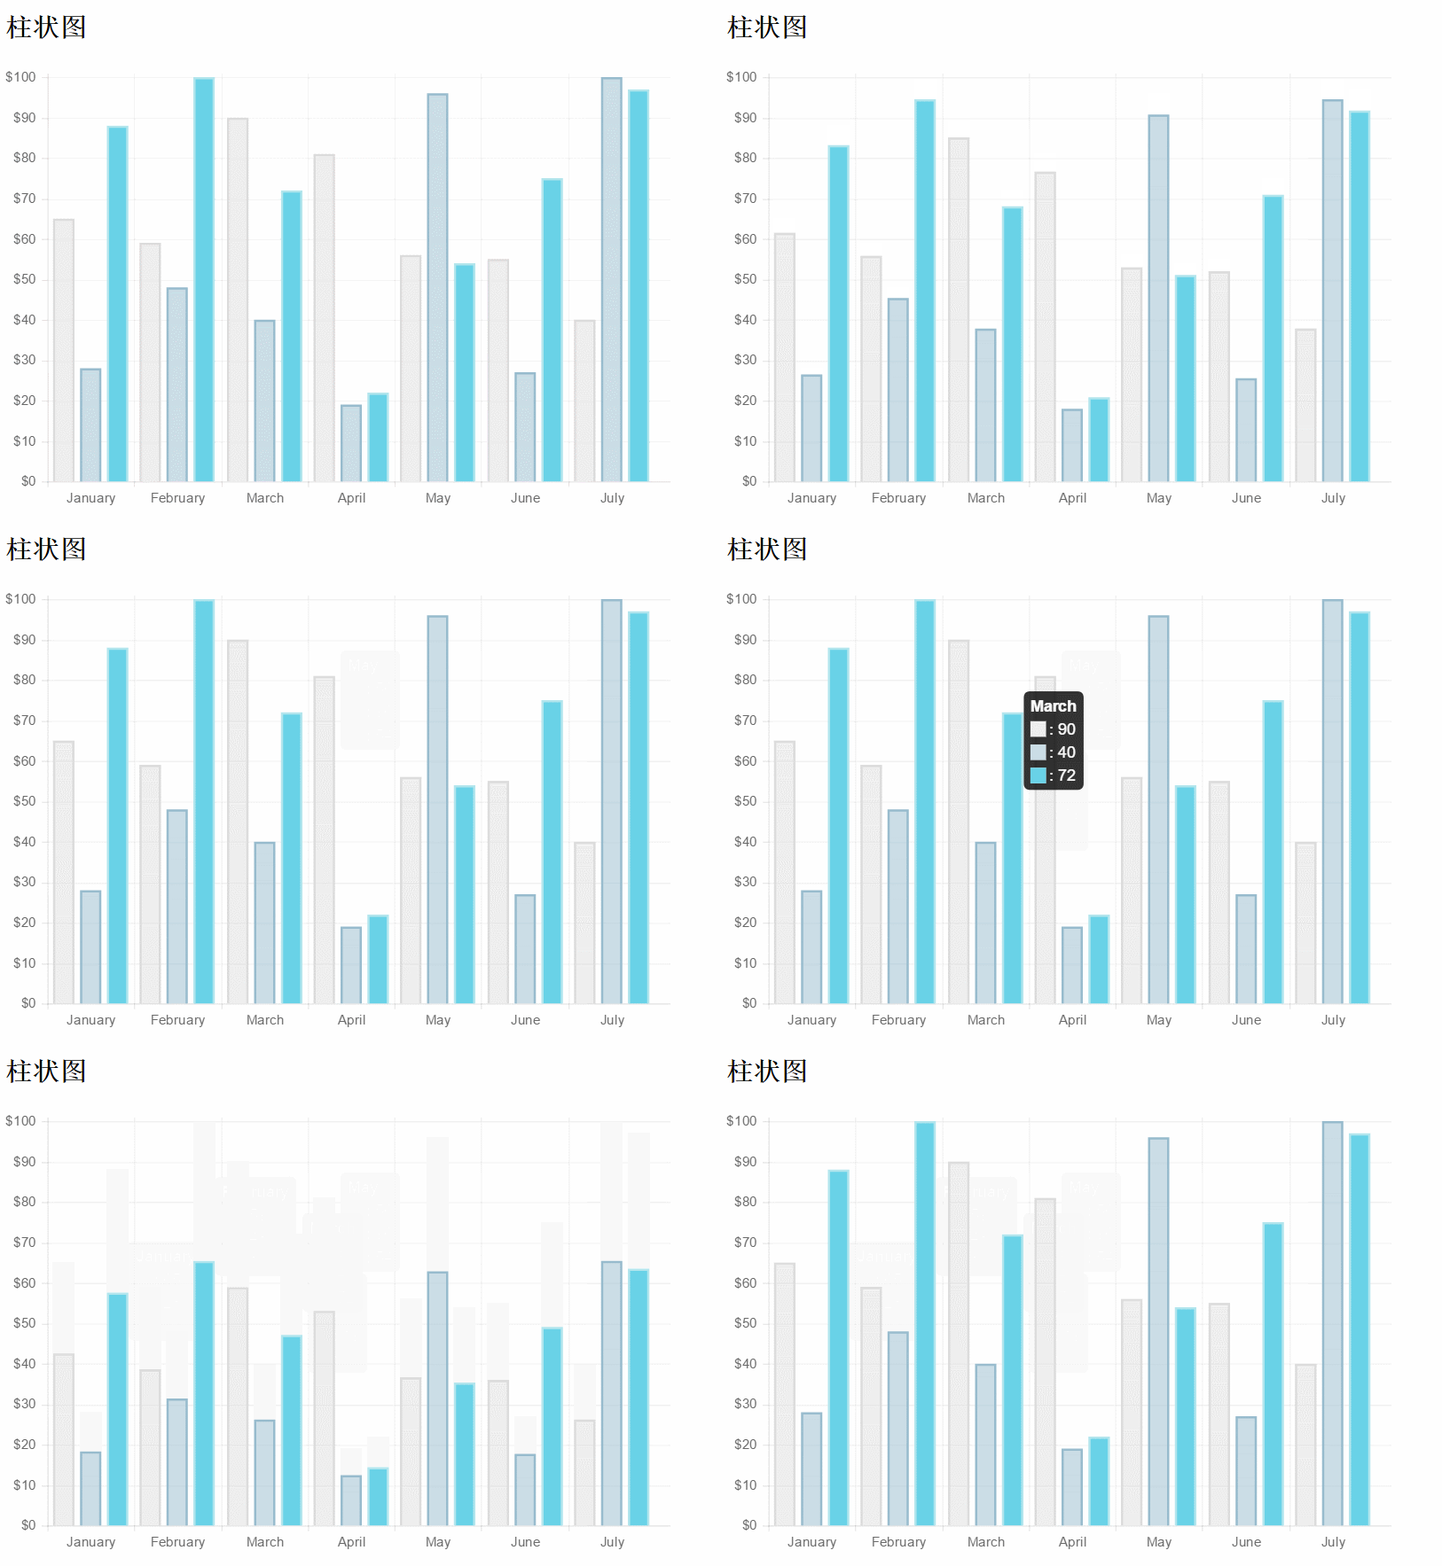
長條圖:
new Chart(ctx).Bar(data,options);//简记,options可缺省資料結構:
var data = {
 labels : ["January","February","March","April","May","June","July"],
 datasets : [
 {
  fillColor : "rgba(220,220,220,0.5)",
  strokeColor : "rgba(220,220,220,1)",
  data : [65,59,90,81,56,55,40]
 },
 {
  fillColor : "rgba(151,187,205,0.5)",
  strokeColor : "rgba(151,187,205,1)",
  data : [28,48,40,19,96,27,100]
 }
 ]
}
圖示參數:
Bar.defaults = {
  //网格线是否在数据线的上面
  scaleOverlay : false,
  //是否用硬编码重写y轴网格线
  scaleOverride : false,
  //** Required if scaleOverride is true **
  //y轴刻度的个数
  scaleSteps : null,
  //y轴每个刻度的宽度
  scaleStepWidth : null,
  //Y轴起始值
  scaleStartValue: null,
  // Y/X轴的颜色
  scaleLineColor: "rgba(0,0,0,.1)",
   // X,Y轴的宽度
  scaleLineWidth: 1,
  // 刻度是否显示标签, 即Y轴上是否显示文字
  scaleShowLabels: false,
  // Y轴上的刻度,即文字
  scaleLabel: "<%=value%>",
  // 字体
  scaleFontFamily: "'Arial'",
   // 文字大小
  scaleFontSize: 12,
  // 文字样式
  scaleFontStyle: "normal",
  // 文字颜色
  scaleFontColor: "#666",
  // 是否显示网格
  scaleShowGridLines: true,
  // 网格颜色
  scaleGridLineColor: "rgba(0,0,0,.05)",
  // 网格宽度
  scaleGridLineWidth: 1,
  //Bar Chart图表特定参数:
  //是否绘制柱状条的边框
  barShowStroke : true,
  //柱状条边框的宽度
  barStrokeWidth : 2,
  //柱状条组之间的间距(过大或过小会出现重叠偏移错位的效果,请控制合理数值)
  barValueSpacing :5,
  //每组柱状条组中柱状条之间的间距
  barDatasetSpacing :5,
  // 是否显示提示
  showTooltips: true,
  // 是否执行动画
  animation: true,
  // 动画的时间
  animationSteps: 60,
  // 动画的特效
  animationEasing: "easeOutQuart",
  // 动画完成时的执行函数
  onAnimationComplete: null
  }
部分javascript實例
var barChart = new Chart(ctx).Bar(data, {
   scaleLabel: "$"+"<%=value%>",
   //是否绘制柱状条的边框
   barShowStroke: true,
   //柱状条边框的宽度
   barStrokeWidth: 2,
   //柱状条组之间的间距(过大或过小会出现重叠偏移错位的效果,请控制合理数值)
   barValueSpacing: 5,
   //每组柱状条组中柱状条之间的间距
   barDatasetSpacing: 5,
   });
效果圖:

##javascript:
new Chart(ctx).Pie(data,options);資料結構:
var data=[
  {
  value:40,
  color:"#21F0EA",//背景色
  highlight:"#79E8E5",//高亮背景颜色
  label:'javascript'//文字标签
  },{
  value:60,
  color:"#E0E4CC",
  highlight:"#EAEDD8",
  label:'jquery'
  },{
  value:100,
  color:"#69D2E7",
  highlight:"#83E5F7",
  label:'html'
  }
 ];
圖示參數:
Pie.defaults = {
   //是否显示每段行程(即扇形区,不为true则无法看到后面设置的边框颜色)
   segmentShowStroke : true,
   //设置每段行程的边框颜色
   segmentStrokeColor : "red",
   //心啊是每段扇区边框的宽度
   segmentStrokeWidth :2,
   //Boolean - 是否执行动画
   animation : true,
   //Number - 动画时间
   animationSteps : 100,
   //String - 动画的效果
   animationEasing : "easeOutBounce",
   //Boolean -是否旋转动画
   animateRotate : true,
   //Boolean - 是否动画缩放饼图中心(效果不错)
   animateScale : true,
   //Function - 火动画完成时执行的函数
   onAnimationComplete : null
  }
部分javascript實例:
var ctx=document.getElementById("pieChart").getContext("2d");
window.pieChart=new Chart(ctx).Pie(data,{
   //是否显示每段行程(即扇形区,不为true则无法看到后面设置的边框颜色)
   segmentShowStroke : true,
   //设置每段行程的边框颜色
   segmentStrokeColor : "red",
   //每段扇区边框的宽度
   segmentStrokeWidth :2,
   //Boolean - 是否执行动画
   animation : true,
   //Number - 动画时间
   animationSteps : 100,
   //String - 动画的效果
   animationEasing : "easeOutBounce",
   //Boolean -是否旋转动画
   animateRotate : true,
   //Boolean - 是否动画缩放饼图中心(效果不错)
   animateScale : true,
   //Function - 动画完成时执行的函数
   //onAnimationComplete : null
  });
效果圖:

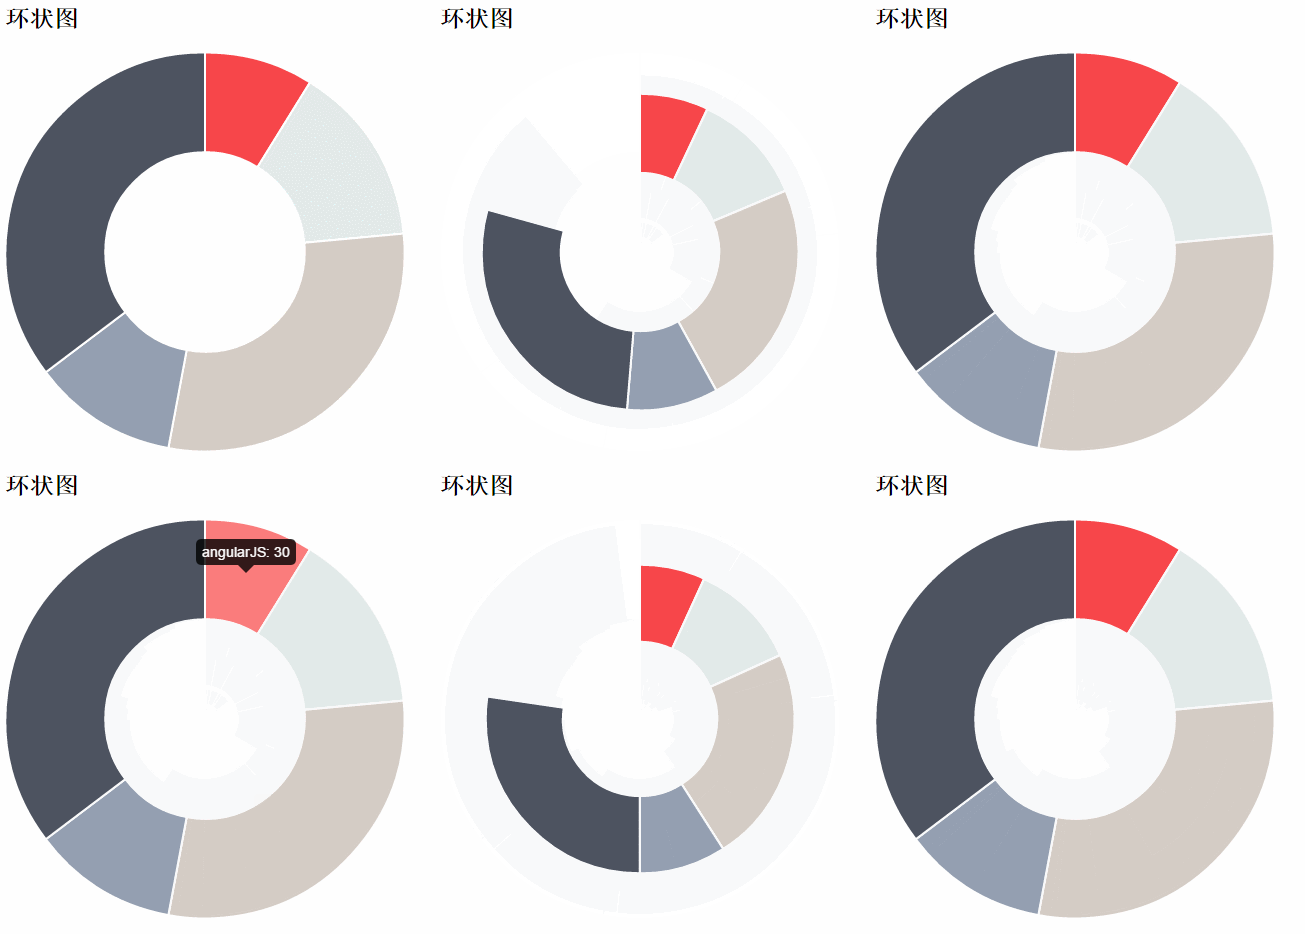
環形圖:
javascript:new Chart(ctx).Doughnut(data,options);資料結構:
//数据结构(与饼图相似)
  var data = [{
  value: 30,
  color: "#F7464A",
  highlight: "#FA7C7C",
  label: "angularJS"
  }, {
  value: 50,
  color: "#E2EAE9",
  highlight: "#F2F5F5",
  label: "juqery"
  }, {
  value: 100,
  color: "#D4CCC5",
  hightlight: "#DBD6D1",
  label: "javascript"
  }, {
  value: 40,
  color: "#949FB1",
  highlight: "#AFBCCE",
  label: "nodeJS"
  }, {
  value: 120,
  color: "#4D5360",
  highlight: "#767C86",
  label: "html"
  }];
圖示參數:
Doughnut.defaults={
   //是否显示每段行程(即环形区,不为true则无法看到后面设置的边框颜色)
   segmentShowStroke: true,
   //设置每段行程的边框颜色
   segmentStrokeColor: "#fff",
   //设置每段环形的边框宽度
   segmentStrokeWidth: 2,
   //图标中心剪切圆的比例(0为饼图,接近100则环形宽度越小)
   percentageInnerCutout: 50,
   //是否执行动画
   animation: true,
   //执行动画时间
   animationSteps: 100,
   //动画特效
   animationEasing: "easeOutBounce",
   //是否旋转动画
   animateRotate: true,
   //是否缩放图表中心
   animateScale: true,
   //动画完成时的回调函数
//   onAnimationComplete: null
  }
效果圖:

<h2>柱状图</h2>
<canvas id="barChart" width="400" height="300"></canvas>
<!--这里添加了用来放置图例的p标签-->
<p id="legend"></p>
css部分:(不設定基礎樣式的話,可能看不出預期的效果)
 <style>
  ul,li{
  list-style-type:none;;
  }
  ul>li{
  margin:5px auto;
  font-family: "微软雅黑";
  }
  span{
  display: inline-block;
  width:20px;height:20px;line-height: 20px;
  vertical-align:middle;
  margin-right:5px;
  }
 </style>
javascript部分:
window.onload = function() {
   var ctx = document.getElementById("barChart").getContext("2d");
   var barChart = new Chart(ctx).Bar(data, {
   showTooltips: false, // 是否显示提示,这里需要设置为false
   //模板
   legendTemplate:
   '<ul class=\"<%=name.toLowerCase()%>-legend\">'+
   '<% for (var i=0; i<datasets.length; i++){%>'+
   '<li><span style=\"background-color:<%=datasets[i].fillColor%>\"></span>'+
   '<%if(datasets[i].label){%><%=datasets[i].label%><%}%></li>'+
   '<%}%>'+
   '</ul>',
   onAnimationComplete: function() {//动画完成后显示对应的数据
    var ctx = this.chart.ctx;
    ctx.font = this.scale.font;
    ctx.fillStyle = this.scale.textColor;
    ctx.textAlign = 'center';
    ctx.textBaseline = 'bottom';
    this.datasets.forEach(function(dataset) {
    dataset.bars.forEach(function(bar) {
     ctx.fillText(bar.value, bar.x, bar.y);
    });
    });
   }
   });
   var legend = document.getElementById('legend');
   // 图例
   legend.innerHTML = barChart.generateLegend();
  }
 //数据结构:
  var data = {
  labels: ["一月", "二月", "三月", "四月", "五月", "六月", "七月"],
  datasets: [{
   fillColor: "rgba(220,220,220,0.5)",
   strokeColor: "rgba(220,220,220,1)",
   data: [65, 59, 90, 81, 56, 55, 40],
   label: "本月销售额"//图例标签
  },{
   fillColor: "#69D2E7",
   strokeColor: "#B2E5ED",
   data: [54, 99, 72, 61, 86, 65, 84],
   label: "本季度销售额"
  }]
  };
效果圖:

以上是Chart.js 輕量級HTML5圖表繪製工具庫使用詳解的詳細內容。更多資訊請關注PHP中文網其他相關文章!
陳述:
本文內容由網友自願投稿,版權歸原作者所有。本站不承擔相應的法律責任。如發現涉嫌抄襲或侵權的內容,請聯絡admin@php.cn

