php使用Jpgraph繪製座標圖基礎篇
- *文原創
- 2017-12-28 11:26:422126瀏覽
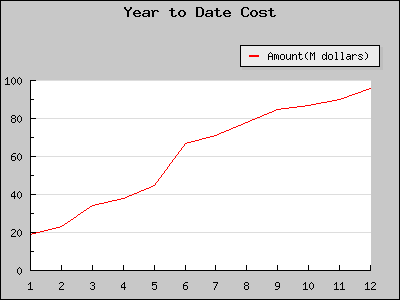
本文主要介紹了php使用Jpgraph繪製簡單X-Y座標圖的方法,實例分析了Jpgraph繪製座標圖及繪製曲線的相關技巧。希望對大家有幫助。
具體實作方法如下:
<?php
include ("src/jpgraph.php");
include ("src/jpgraph_line.php");
//将要用于图表创建的数据存放在数组中
$data = array(19,23,34,38,45,67,71,78,85,87,90,96);
$graph = new Graph(400,300); //创建新的Graph对象
$graph->SetScale("textlin"); //设置刻度样式
$graph->img->SetMargin(30,30,80,30); //设置图表边界
$graph->title->Set("Year to Date Cost"); //设置图表标题
// Create the linear plot
$lineplot=new LinePlot($data); // 创建新的LinePlot对象
$lineplot->SetLegend("Amount(M dollars)"); //设置图例文字
$lineplot->SetColor("red"); // 设置曲线的颜色
// Add the plot to the graph
$graph->Add($lineplot); //在统计图上绘制曲线
// Display the graph
$graph->Stroke(); //输出图像
?>
#運行後效果圖如下:

相關推薦:
Jpgraph類別庫簡介ntgraph graph下載pyqtgrap
#以上是php使用Jpgraph繪製座標圖基礎篇的詳細內容。更多資訊請關注PHP中文網其他相關文章!
陳述:
本文內容由網友自願投稿,版權歸原作者所有。本站不承擔相應的法律責任。如發現涉嫌抄襲或侵權的內容,請聯絡admin@php.cn
上一篇:php實作讀寫tab分割的文件下一篇:php實作讀寫tab分割的文件

