


之前分享過兩篇關於流程畫圖的前端元件,使用的jsPlumb。這個元件本身還不錯,使用方便、入門簡單、輕量級,但是使用一段時間下來,發現一些弊病,比如組件不太穩定,初始進入頁面的時候連線的樣式有時會亂掉,刷新頁面之後才能恢復正常,而且連線樣式比較單一,容易讓人產生視覺疲勞,加之最近公司在大力推行所謂的“工業4.0”,除了對自動化控制要求的提高之外,對這種圖形化界面的要求也隨之提高,所以單純的jsPlumb元件效果已經無法滿足日益發展的公司業務。基於以上種種,最終找到了Gojs元件,它效果強大、api豐富,唯一的不足是這個元件是一個收費元件。
一、元件效果預覽
先來兩個酷炫點的效果
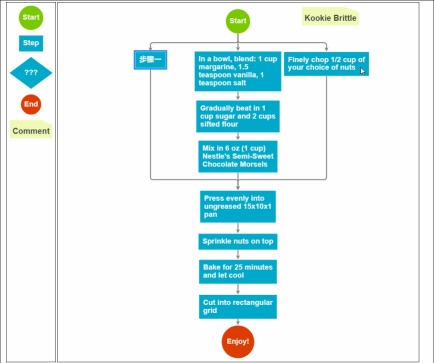


就最下面兩個效果而言,就是jsPlumb無法實現的,可是這種效果在MES系統裡面是很吸引人的,尤其是一些流程性的業務,用這種效果實現讓可以一眼就感覺高大上了。而且咋一眼看上去,你根本都不相信這是一個web頁面的效果。
其他效果範例

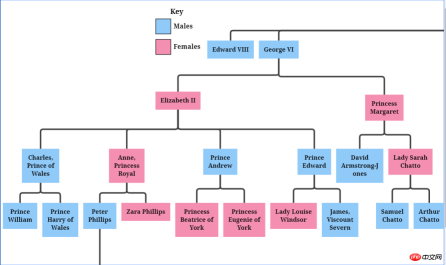
可折疊的樹

#這是圖片嗎?

竟然還可以產生圖表!

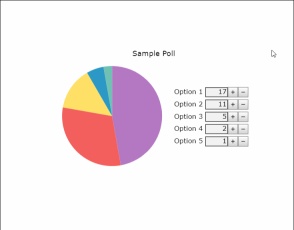

#想搶visio的飯碗嗎?


# 更多範例可查看官網
二、初次接觸
1、Gojs簡介
#GoJS是一個功能豐富的JS函式庫,在網頁瀏覽器和平台上可實現自訂互動圖和複雜的視覺化效果,它用自訂模板和佈局元件簡化了節點、連結和分組等複雜的JS圖表,給用戶互動提供了許多先進的功能,如拖曳、複製、貼上、文字編輯、工具提示、上下文選單、自動佈局、範本、資料綁定和模型、交易狀態和撤銷管理、調色板、概述、事件處理程序、命令和自訂操作的擴展工具系統。無需切換伺服器和插件,GoJS就能實現使用者互動並在瀏覽器中完全運行,呈現HTML5 Canvas元素或SVG,也不用伺服器端請求。 GoJS不依賴任何JS函式庫或框架(例如bootstrap、jquery等),可與任何HTML或JS框架配合工作,甚至可以不用框架。
2、使用入門
(1)檔案引用
複製程式碼 程式碼如下:
<script src="gojs/go-debug_ok.js"></script>
可以用cdn上面的最新版本,也可以引用本地down下來的檔案。如果是開發,可以引用debug版本的js,正式運行的時候引用正式的js,這個就不需要多講。
(2)建立畫布
隨便定義一個html元素,作為我們的畫布
##複製程式碼 程式碼如下:
<p id="myDiagramp" style="margin:auto;width:300px; height:300px; background-color:#ddd;"></p>接著使用gojs的api初始化畫布
//创建画布
  var objGo = go.GraphObject.make;
  var myDiagram = objGo(go.Diagram, "myDiagramp",
   {
    //模型图的中心位置所在坐标
    initialContentAlignment: go.Spot.Center,

    //允许用户操作图表的时候使用Ctrl-Z撤销和Ctrl-Y重做快捷键
    "undoManager.isEnabled": true,

    //不运行用户改变图表的规模
    allowZoom: false,

    //画布上面是否出现网格
    "grid.visible": true,

    //允许在画布上面双击的时候创建节点
    "clickCreatingTool.archetypeNodeData": { text: "Node" },

    //允许使用ctrl+c、ctrl+v复制粘贴
    "commandHandler.copiesTree": true,

    //允许使用delete键删除节点
    "commandHandler.deletesTree": true,

    // dragging for both move and copy
    "draggingTool.dragsTree": true,
   });
官方範例用的$符號作為變量,博主覺得$符號太敏感,還是換個名字吧~以上幾個參數都是博主摘選的,更多初始化畫布的參數請參考官方api下圖:

(3)创建模型数据(Model)
接着上面的代码,我们增加如下几行
var myModel = objGo(go.Model);//创建Model对象
  // model中的数据每一个js对象都代表着一个相应的模型图中的元素
  myModel.nodeDataArray = [
   { key: "工厂" },
   { key: "车间" },
   { key: "工人" },
   { key: "岗位" },
  ];
  myDiagram.model = myModel; //将模型数据绑定到画布图上
效果预览

(4)创建节点(Node)
上面有了画布和节点数据,只是有了一个雏形,但是还没有任何的图形化效果。我们加入一些效果试试
在gojs里面给我们提供了几种模型节点的可选项:
Shape:形状——Rectangle(矩形)、RoundedRectangle(圆角矩形),Ellipse(椭圆形),Triangle(三角形),Diamond(菱形),Circle(圆形)等
TextBlock:文本域(可编辑)
Picture:图片
Panel:容器来保存其他Node的集合
默认的节点模型代码只是由一个TextBlock组件构建成
我们增加如下一段代码
// 定义一个简单的节点模板
  myDiagram.nodeTemplate =
   objGo(go.Node, "Horizontal",//横向布局的面板
    // 节点淡蓝色背景
    { background: "#44CCFF" },
    objGo(go.Shape,
     "RoundedRectangle", //定义形状,这是圆角矩形
     { /* Shape的参数。宽高颜色等等*/figure: "Club", width: 40, height: 60, margin: 4, fill: 'red' },
     // 绑定 Shape.figure属性为Node.data.fig的值,Model对象可以通过Node.data.fig 获取和设置Shape.figure(修改形状)
     new go.Binding("figure", "fig"), new go.Binding('fill', 'fill2')),
    objGo(go.TextBlock,
     "Default Text", // 默认文本
     // 设置字体大小颜色以及边距
     { margin: 12, stroke: "white", font: "bold 16px sans-serif" },
     //绑定TextBlock.text 属性为Node.data.name的值,Model对象可以通过Node.data.name获取和设置TextBlock.text
     new go.Binding("text", "name"))
   );

  var myModel = objGo(go.Model);//创建Model对象
  // model中的数据每一个js对象都代表着一个相应的模型图中的元素
  myModel.nodeDataArray = [
   { name: "工厂", fig: 'YinYang', fill2: 'blue' },
   { name: "车间", fig: 'Peace', fill2: 'red' },
   { name: "工人", fig: 'NotAllowed', fill2: 'green' },
   { name: "岗位", fig: 'Fragile', fill2: 'yellow' },
  ];
  myDiagram.model = myModel; //将模型数据绑定到画布图上
代码释疑:以上我们给画布对象定义了两种节点模板,一种是文本节点,另一种是形状节点(Node)。在形状节点中,我们定义了数据模型的通用节点样式,就是这一段代码{ /* Shape的参数。宽高颜色等等*/figure: "Club", width: 40, height: 60, margin: 4, fill: 'red' },然后通过new go.Binding("figure", "fig")方法将模板里面的属性映射到数据实例中,比如这里模板里面的figure属性定义的是Club,如果在我们的数据里面定义fig属性,那么它就会覆盖模板里面的figure的默认值。同样,fill和fill2也是通过同样的原理去区别模板中的样式和实例中的实际样式的!
注:更多figure属性的取值详见这里
效果如下

由此可见我们数据里面的属性会覆盖模板的原始属性,如果是新增的节点,由于没有自定义数据属性,所以呈现到界面上面的时候就是模板里面的原生样式!
(5)节点连线
有了上面的基础,我们可以在画布上面画出我们想要的图形效果了,可是还没有连线。我们知道连线是建立在节点模型的上面的,于是乎我们的Model又分为了以下三种类型:
Model:最基本的(不带连线,如上面的例子)
GraphLinksModel :高级点的动态连线图
TreeModel:树形图的模型(从例子看好像用的不多)
GraphLinksModel中为model.nodeDataArray提供model.linkDataArray为node节点连线保存数据模型信息,其实也是的一个JSON数组对象,每个线条都有两个属性 “to” 和 “from” 即Node节点的“key”值,两个属性代表两个key表示两个节点间的连线。
我们上面已经写过最基本的Model的例子了,我们再来个带连线的Model的示例
var myModel = objGo(go.GraphLinksModel);
  myModel.nodeDataArray =
   [
    { key: "aaa" ,name: "工厂" },
    { key: "bbb" ,name: "车间"},
    { key: "ccc" ,name: "车间" }
   ];
  myModel.linkDataArray =
   [
    { from: "aaa", to: "bbb" },
    { from: "bbb", to: "ccc" }
   ];
  myDiagram.model = myModel;
效果如下

学习了Model、GraphLinksModel,还剩下一种TreeModel树节点的模型,这个博主不打算做详细介绍,有兴趣可以直接查看官网。
三、综合效果
关于综合效果,博主不打算将gojs的api逐个翻个遍了,这样太耗时间,伤不起,只是将官方示例中的部分源码截取出来供大家参考。有需要的再细究!
1、自定义流程的使用
<!DOCTYPE html>
<html>
<head>
<meta name="viewport" content="width=device-width, initial-scale=1">
<title>Draggable Link</title>
<meta name="description" content="Drag a link to reconnect it. Nodes have custom Adornments for selection, resizing, and reshaping." />
<!-- Copyright 1998-2017 by Northwoods Software Corporation. -->
<meta charset="UTF-8">
<script src="../../gojs/go-debug.js"></script>
<script id="code">
function init() {
if (window.goSamples) goSamples(); // init for these samples -- you don't need to call this
var objGo = go.GraphObject.make; // for conciseness in defining templates
myDiagram =
objGo(go.Diagram, "myDiagramp", // must name or refer to the p HTML element
{
grid: objGo(go.Panel, "Grid",
objGo(go.Shape, "LineH", { stroke: "lightgray", strokeWidth: 0.5 }),
objGo(go.Shape, "LineH", { stroke: "gray", strokeWidth: 0.5, interval: 10 }),
objGo(go.Shape, "LineV", { stroke: "lightgray", strokeWidth: 0.5 }),
objGo(go.Shape, "LineV", { stroke: "gray", strokeWidth: 0.5, interval: 10 })
),
allowDrop: true, // must be true to accept drops from the Palette
"draggingTool.dragsLink": true,
"draggingTool.isGridSnapEnabled": true,
"linkingTool.isUnconnectedLinkValid": true,
"linkingTool.portGravity": 20,
"relinkingTool.isUnconnectedLinkValid": true,
"relinkingTool.portGravity": 20,
"relinkingTool.fromHandleArchetype":
objGo(go.Shape, "Diamond", { segmentIndex: 0, cursor: "pointer", desiredSize: new go.Size(8, 8), fill: "tomato", stroke: "darkred" }),
"relinkingTool.toHandleArchetype":
objGo(go.Shape, "Diamond", { segmentIndex: -1, cursor: "pointer", desiredSize: new go.Size(8, 8), fill: "darkred", stroke: "tomato" }),
"linkReshapingTool.handleArchetype":
objGo(go.Shape, "Diamond", { desiredSize: new go.Size(7, 7), fill: "lightblue", stroke: "deepskyblue" }),
rotatingTool: objGo(TopRotatingTool), // defined below
"rotatingTool.snapAngleMultiple": 15,
"rotatingTool.snapAngleEpsilon": 15,
"undoManager.isEnabled": true
});
// when the document is modified, add a "*" to the title and enable the "Save" button
myDiagram.addDiagramListener("Modified", function(e) {
var button = document.getElementById("SaveButton");
if (button) button.disabled = !myDiagram.isModified;
var idx = document.title.indexOf("*");
if (myDiagram.isModified) {
if (idx < 0) document.title += "*";
} else {
if (idx >= 0) document.title = document.title.substr(0, idx);
}
});
// Define a function for creating a "port" that is normally transparent.
// The "name" is used as the GraphObject.portId, the "spot" is used to control how links connect
// and where the port is positioned on the node, and the boolean "output" and "input" arguments
// control whether the user can draw links from or to the port.
function makePort(name, spot, output, input) {
// the port is basically just a small transparent square
return objGo(go.Shape, "Circle",
{
fill: null, // not seen, by default; set to a translucent gray by showSmallPorts, defined below
stroke: null,
desiredSize: new go.Size(7, 7),
alignment: spot, // align the port on the main Shape
alignmentFocus: spot, // just inside the Shape
portId: name, // declare this object to be a "port"
fromSpot: spot, toSpot: spot, // declare where links may connect at this port
fromLinkable: output, toLinkable: input, // declare whether the user may draw links to/from here
cursor: "pointer" // show a different cursor to indicate potential link point
});
}
var nodeSelectionAdornmentTemplate =
objGo(go.Adornment, "Auto",
objGo(go.Shape, { fill: null, stroke: "deepskyblue", strokeWidth: 1.5, strokeDashArray: [4, 2] }),
objGo(go.Placeholder)
);
var nodeResizeAdornmentTemplate =
objGo(go.Adornment, "Spot",
{ locationSpot: go.Spot.Right },
objGo(go.Placeholder),
objGo(go.Shape, { alignment: go.Spot.TopLeft, cursor: "nw-resize", desiredSize: new go.Size(6, 6), fill: "lightblue", stroke: "deepskyblue" }),
objGo(go.Shape, { alignment: go.Spot.Top, cursor: "n-resize", desiredSize: new go.Size(6, 6), fill: "lightblue", stroke: "deepskyblue" }),
objGo(go.Shape, { alignment: go.Spot.TopRight, cursor: "ne-resize", desiredSize: new go.Size(6, 6), fill: "lightblue", stroke: "deepskyblue" }),
objGo(go.Shape, { alignment: go.Spot.Left, cursor: "w-resize", desiredSize: new go.Size(6, 6), fill: "lightblue", stroke: "deepskyblue" }),
objGo(go.Shape, { alignment: go.Spot.Right, cursor: "e-resize", desiredSize: new go.Size(6, 6), fill: "lightblue", stroke: "deepskyblue" }),
objGo(go.Shape, { alignment: go.Spot.BottomLeft, cursor: "se-resize", desiredSize: new go.Size(6, 6), fill: "lightblue", stroke: "deepskyblue" }),
objGo(go.Shape, { alignment: go.Spot.Bottom, cursor: "s-resize", desiredSize: new go.Size(6, 6), fill: "lightblue", stroke: "deepskyblue" }),
objGo(go.Shape, { alignment: go.Spot.BottomRight, cursor: "sw-resize", desiredSize: new go.Size(6, 6), fill: "lightblue", stroke: "deepskyblue" })
);
var nodeRotateAdornmentTemplate =
objGo(go.Adornment,
{ locationSpot: go.Spot.Center, locationObjectName: "CIRCLE" },
objGo(go.Shape, "Circle", { name: "CIRCLE", cursor: "pointer", desiredSize: new go.Size(7, 7), fill: "lightblue", stroke: "deepskyblue" }),
objGo(go.Shape, { geometryString: "M3.5 7 L3.5 30", isGeometryPositioned: true, stroke: "deepskyblue", strokeWidth: 1.5, strokeDashArray: [4, 2] })
);
myDiagram.nodeTemplate =
objGo(go.Node, "Spot",
{ locationSpot: go.Spot.Center },
new go.Binding("location", "loc", go.Point.parse).makeTwoWay(go.Point.stringify),
{ selectable: true, selectionAdornmentTemplate: nodeSelectionAdornmentTemplate },
{ resizable: true, resizeObjectName: "PANEL", resizeAdornmentTemplate: nodeResizeAdornmentTemplate },
{ rotatable: true, rotateAdornmentTemplate: nodeRotateAdornmentTemplate },
new go.Binding("angle").makeTwoWay(),
// the main object is a Panel that surrounds a TextBlock with a Shape
objGo(go.Panel, "Auto",
{ name: "PANEL" },
new go.Binding("desiredSize", "size", go.Size.parse).makeTwoWay(go.Size.stringify),
objGo(go.Shape, "Rectangle", // default figure
{
portId: "", // the default port: if no spot on link data, use closest side
fromLinkable: true, toLinkable: true, cursor: "pointer",
fill: "white", // default color
strokeWidth: 2
},
new go.Binding("figure"),
new go.Binding("fill")),
objGo(go.TextBlock,
{
font: "bold 11pt Helvetica, Arial, sans-serif",
margin: 8,
maxSize: new go.Size(160, NaN),
wrap: go.TextBlock.WrapFit,
editable: true
},
new go.Binding("text").makeTwoWay())
),
// four small named ports, one on each side:
makePort("T", go.Spot.Top, false, true),
makePort("L", go.Spot.Left, true, true),
makePort("R", go.Spot.Right, true, true),
makePort("B", go.Spot.Bottom, true, false),
{ // handle mouse enter/leave events to show/hide the ports
mouseEnter: function(e, node) { showSmallPorts(node, true); },
mouseLeave: function(e, node) { showSmallPorts(node, false); }
}
);
function showSmallPorts(node, show) {
node.ports.each(function(port) {
if (port.portId !== "") { // don't change the default port, which is the big shape
port.fill = show ? "rgba(0,0,0,.3)" : null;
}
});
}
var linkSelectionAdornmentTemplate =
objGo(go.Adornment, "Link",
objGo(go.Shape,
// isPanelMain declares that this Shape shares the Link.geometry
{ isPanelMain: true, fill: null, stroke: "deepskyblue", strokeWidth: 0 }) // use selection object's strokeWidth
);
myDiagram.linkTemplate =
objGo(go.Link, // the whole link panel
{ selectable: true, selectionAdornmentTemplate: linkSelectionAdornmentTemplate },
{ relinkableFrom: true, relinkableTo: true, reshapable: true },
{
routing: go.Link.AvoidsNodes,
curve: go.Link.JumpOver,
corner: 5,
toShortLength: 4
},
new go.Binding("points").makeTwoWay(),
objGo(go.Shape, // the link path shape
{ isPanelMain: true, strokeWidth: 2 }),
objGo(go.Shape, // the arrowhead
{ toArrow: "Standard", stroke: null }),
objGo(go.Panel, "Auto",
new go.Binding("visible", "isSelected").ofObject(),
objGo(go.Shape, "RoundedRectangle", // the link shape
{ fill: "#F8F8F8", stroke: null }),
objGo(go.TextBlock,
{
textAlign: "center",
font: "10pt helvetica, arial, sans-serif",
stroke: "#919191",
margin: 2,
minSize: new go.Size(10, NaN),
editable: true
},
new go.Binding("text").makeTwoWay())
)
);
load(); // load an initial diagram from some JSON text
// initialize the Palette that is on the left side of the page
myPalette =
objGo(go.Palette, "myPalettep", // must name or refer to the p HTML element
{
maxSelectionCount: 1,
nodeTemplateMap: myDiagram.nodeTemplateMap, // share the templates used by myDiagram
linkTemplate: // simplify the link template, just in this Palette
objGo(go.Link,
{ // because the GridLayout.alignment is Location and the nodes have locationSpot == Spot.Center,
// to line up the Link in the same manner we have to pretend the Link has the same location spot
locationSpot: go.Spot.Center,
selectionAdornmentTemplate:
objGo(go.Adornment, "Link",
{ locationSpot: go.Spot.Center },
objGo(go.Shape,
{ isPanelMain: true, fill: null, stroke: "deepskyblue", strokeWidth: 0 }),
objGo(go.Shape, // the arrowhead
{ toArrow: "Standard", stroke: null })
)
},
{
routing: go.Link.AvoidsNodes,
curve: go.Link.JumpOver,
corner: 5,
toShortLength: 4
},
new go.Binding("points"),
objGo(go.Shape, // the link path shape
{ isPanelMain: true, strokeWidth: 2 }),
objGo(go.Shape, // the arrowhead
{ toArrow: "Standard", stroke: null })
),
model: new go.GraphLinksModel([ // specify the contents of the Palette
{ text: "Start", figure: "Circle", fill: "#00AD5F" },
{ text: "Step" },
{ text: "DB", figure: "Database", fill: "lightgray" },
{ text: "???", figure: "Diamond", fill: "lightskyblue" },
{ text: "End", figure: "Circle", fill: "#CE0620" },
{ text: "Comment", figure: "RoundedRectangle", fill: "lightyellow" }
], [
// the Palette also has a disconnected Link, which the user can drag-and-drop
{ points: new go.List(go.Point).addAll([new go.Point(0, 0), new go.Point(30, 0), new go.Point(30, 40), new go.Point(60, 40)]) }
])
});
}
function TopRotatingTool() {
go.RotatingTool.call(this);
}
go.Diagram.inherit(TopRotatingTool, go.RotatingTool);
/** @override */
TopRotatingTool.prototype.updateAdornments = function(part) {
go.RotatingTool.prototype.updateAdornments.call(this, part);
var adornment = part.findAdornment("Rotating");
if (adornment !== null) {
adornment.location = part.rotateObject.getDocumentPoint(new go.Spot(0.5, 0, 0, -30)); // above middle top
}
};
/** @override */
TopRotatingTool.prototype.rotate = function(newangle) {
go.RotatingTool.prototype.rotate.call(this, newangle + 90);
};
// end of TopRotatingTool class
// Show the diagram's model in JSON format that the user may edit
function save() {
saveDiagramProperties(); // do this first, before writing to JSON
document.getElementById("mySavedModel").value = myDiagram.model.toJson();
myDiagram.isModified = false;
}
function load() {
myDiagram.model = go.Model.fromJson(document.getElementById("mySavedModel").value);
loadDiagramProperties(); // do this after the Model.modelData has been brought into memory
}
function saveDiagramProperties() {
myDiagram.model.modelData.position = go.Point.stringify(myDiagram.position);
}
function loadDiagramProperties(e) {
// set Diagram.initialPosition, not Diagram.position, to handle initialization side-effects
var pos = myDiagram.model.modelData.position;
if (pos) myDiagram.initialPosition = go.Point.parse(pos);
}
</script>
</head>
<body onload="init()">
<p id="sample">
<p style="width:100%; white-space:nowrap;">
<span style="display: inline-block; vertical-align: top; width:105px">
<p id="myPalettep" style="border: solid 1px black; height: 620px"></p>
</span>
<span style="display: inline-block; vertical-align: top; width:80%">
<p id="myDiagramp" style="border: solid 1px black; height: 620px"></p>
</span>
</p>
<p>
This sample demonstrates the ability for the user to drag around a Link as if it were a Node.
When either end of the link passes over a valid port, the port is highlighted.
</p>
<p>
The link-dragging functionality is enabled by setting some or all of the following properties:
<a>DraggingTool.dragsLink</a>, <a>LinkingTool.isUnconnectedLinkValid</a>, and
<a>RelinkingTool.isUnconnectedLinkValid</a>.
</p>
<p>
Note that a Link is present in the <a>Palette</a> so that it too can be dragged out and onto
the main Diagram. Because links are not automatically routed when either end is not connected
with a Node, the route is provided explicitly when that Palette item is defined.
</p>
<p>
This also demonstrates several custom Adornments:
<a>Part.selectionAdornmentTemplate</a>, <a>Part.resizeAdornmentTemplate</a>, and
<a>Part.rotateAdornmentTemplate</a>.
</p>
<p>
Finally this sample demonstrates saving and restoring the <a>Diagram.position</a> as a property
on the <a>Model.modelData</a> object that is automatically saved and restored when calling <a>Model.toJson</a>
and <a>Model.fromJson</a>.
</p>
<p>
<p>
<button id="SaveButton" onclick="save()">Save</button>
<button onclick="load()">Load</button>
Diagram Model saved in JSON format:
</p>
<textarea id="mySavedModel" style="width:100%;height:300px">
{ "class": "go.GraphLinksModel",
"linkFromPortIdProperty": "fromPort",
"linkToPortIdProperty": "toPort",
"nodeDataArray": [
],
"linkDataArray": [
]}
</textarea>
</p>
</p>
</body>
</html>效果如下:

建议各位copy代码,在本地看到效果,然后再根据实际需求去研究它的api,这样才不会太盲目而花费太多时间。
2、工业流程图
<!DOCTYPE html>
<html>
<head>
<meta name="viewport" content="width=device-width, initial-scale=1">
<title>Process Flow</title>
<meta name="description" content="A simple process flow or SCADA diagram editor, simulating equipment monitoring and control." />
<!-- Copyright 1998-2017 by Northwoods Software Corporation. -->
<meta charset="UTF-8">
<script src="../../gojs/go-debug.js"></script>
<script id="code">
function init() {
if (window.goSamples) goSamples(); // init for these samples -- you don't need to call this
var $ = go.GraphObject.make; // for more concise visual tree definitions
myDiagram =
$(go.Diagram, "myDiagramp",
{
"grid.visible": true,
"grid.gridCellSize": new go.Size(30, 20),
"draggingTool.isGridSnapEnabled": true,
"resizingTool.isGridSnapEnabled": true,
"rotatingTool.snapAngleMultiple": 90,
"rotatingTool.snapAngleEpsilon": 45,
"undoManager.isEnabled": true
});
// when the document is modified, add a "*" to the title and enable the "Save" button
myDiagram.addDiagramListener("Modified", function(e) {
var button = document.getElementById("SaveButton");
if (button) button.disabled = !myDiagram.isModified;
var idx = document.title.indexOf("*");
if (myDiagram.isModified) {
if (idx < 0) document.title += "*";
} else {
if (idx >= 0) document.title = document.title.substr(0, idx);
}
});
myDiagram.nodeTemplateMap.add("Process",
$(go.Node, "Auto",
{ locationSpot: new go.Spot(0.5, 0.5), locationObjectName: "SHAPE",
resizable: true, resizeObjectName: "SHAPE" },
new go.Binding("location", "pos", go.Point.parse).makeTwoWay(go.Point.stringify),
$(go.Shape, "Cylinder1",
{ name: "SHAPE",
strokeWidth: 2,
fill: $(go.Brush, "Linear",
{ start: go.Spot.Left, end: go.Spot.Right,
0: "gray", 0.5: "white", 1: "gray" }),
minSize: new go.Size(50, 50),
portId: "", fromSpot: go.Spot.AllSides, toSpot: go.Spot.AllSides
},
new go.Binding("desiredSize", "size", go.Size.parse).makeTwoWay(go.Size.stringify)),
$(go.TextBlock,
{ alignment: go.Spot.Center, textAlign: "center", margin: 5,
editable: true },
new go.Binding("text").makeTwoWay())
));
myDiagram.nodeTemplateMap.add("Valve",
$(go.Node, "Vertical",
{ locationSpot: new go.Spot(0.5, 1, 0, -21), locationObjectName: "SHAPE",
selectionObjectName: "SHAPE", rotatable: true },
new go.Binding("angle").makeTwoWay(),
new go.Binding("location", "pos", go.Point.parse).makeTwoWay(go.Point.stringify),
$(go.TextBlock,
{ alignment: go.Spot.Center, textAlign: "center", margin: 5, editable: true },
new go.Binding("text").makeTwoWay(),
// keep the text upright, even when the whole node has been rotated upside down
new go.Binding("angle", "angle", function(a) { return a === 180 ? 180 : 0; }).ofObject()),
$(go.Shape,
{ name: "SHAPE",
geometryString: "F1 M0 0 L40 20 40 0 0 20z M20 10 L20 30 M12 30 L28 30",
strokeWidth: 2,
fill: $(go.Brush, "Linear", { 0: "gray", 0.35: "white", 0.7: "gray" }),
portId: "", fromSpot: new go.Spot(1, 0.35), toSpot: new go.Spot(0, 0.35) })
));
myDiagram.linkTemplate =
$(go.Link,
{ routing: go.Link.AvoidsNodes, curve: go.Link.JumpGap, corner: 10, reshapable: true, toShortLength: 7 },
new go.Binding("points").makeTwoWay(),
// mark each Shape to get the link geometry with isPanelMain: true
$(go.Shape, { isPanelMain: true, stroke: "black", strokeWidth: 5 }),
$(go.Shape, { isPanelMain: true, stroke: "gray", strokeWidth: 3 }),
$(go.Shape, { isPanelMain: true, stroke: "white", strokeWidth: 1, name: "PIPE", strokeDashArray: [10, 10] }),
$(go.Shape, { toArrow: "Triangle", fill: "black", stroke: null })
);
load();
loop(); // animate some flow through the pipes
}
function loop() {
var diagram = myDiagram;
setTimeout(function() {
var oldskips = diagram.skipsUndoManager;
diagram.skipsUndoManager = true;
diagram.links.each(function(link) {
var shape = link.findObject("PIPE");
var off = shape.strokeDashOffset - 2;
shape.strokeDashOffset = (off <= 0) ? 20 : off;
});
diagram.skipsUndoManager = oldskips;
loop();
}, 100);
}
function save() {
document.getElementById("mySavedModel").value = myDiagram.model.toJson();
myDiagram.isModified = false;
}
function load() {
myDiagram.model = go.Model.fromJson(document.getElementById("mySavedModel").value);
}
</script>
</head>
<body onload="init()">
<p id="sample">
<p id="myDiagramp" style="border: solid 1px black; width:100%; height:500px"></p>
<p>
A <em>process flow diagram</em> is commonly used in chemical and process engineering to indicate the general flow of plant processes and equipment.
A simple SCADA diagram, with animation of the flow along the pipes, is implemented here.
</p>
<p>
The diagram displays the background grid layer by setting <b>grid.visible</b> to true,
and also allows snapping to the grid using <a>DraggingTool.isGridSnapEnabled</a>,
<a>ResizingTool.isGridSnapEnabled</a>, and <a>RotatingTool.snapAngleMultiple</a> alongside <a>RotatingTool.snapAngleEpsilon</a>.
</p>
<p>
The diagram also uses the <b>loop</b> function to animate the links by adjusting the <a>Shape.strokeDashOffset</a> every 100 ms.
</p>
<p>
<p>
<button id="SaveButton" onclick="save()">Save</button>
<button onclick="load()">Load</button>
Diagram Model saved in JSON format:
</p>
<textarea id="mySavedModel" style="width:100%;height:300px">
{ "class": "go.GraphLinksModel",
"nodeDataArray": [
{"key":"P1", "category":"Process", "pos":"150 120", "text":"Process"},
{"key":"P2", "category":"Process", "pos":"330 320", "text":"Tank"},
{"key":"V1", "category":"Valve", "pos":"270 120", "text":"V1"},
{"key":"P3", "category":"Process", "pos":"150 420", "text":"Pump"},
{"key":"V2", "category":"Valve", "pos":"150 280", "text":"VM", "angle":270},
{"key":"V3", "category":"Valve", "pos":"270 420", "text":"V2", "angle":180},
{"key":"P4", "category":"Process", "pos":"450 140", "text":"Reserve Tank"},
{"key":"V4", "category":"Valve", "pos":"390 60", "text":"VA"},
{"key":"V5", "category":"Valve", "pos":"450 260", "text":"VB", "angle":90}
],
"linkDataArray": [
{"from":"P1", "to":"V1"},
{"from":"P3", "to":"V2"},
{"from":"V2", "to":"P1"},
{"from":"P2", "to":"V3"},
{"from":"V3", "to":"P3"},
{"from":"V1", "to":"V4"},
{"from":"V4", "to":"P4"},
{"from":"V1", "to":"P2"},
{"from":"P4", "to":"V5"},
{"from":"V5", "to":"P2"}
]}
</textarea>
</p>
</p>
</body>
</html>工业流程图

四、总结
本文根据js的一些基础用法做了简单介绍,今天就先到这里,以后有问题了再来跟大家分享。如果你的项目里面也有这种业务需求,可以用起来试试!需要说明一点,如果您的公司不缺钱,建议使用正版授权的组件,毕竟尊重作者的劳动成果很重要!
相关推荐:
解決JS元件bootstrap table分頁實作過程中遇到的問題
以上是JS前端圖形化插件之利器Gojs元件的詳細內容。更多資訊請關注PHP中文網其他相關文章!

 JavaScript引擎:比較實施Apr 13, 2025 am 12:05 AM
不同JavaScript引擎在解析和執行JavaScript代碼時,效果會有所不同,因為每個引擎的實現原理和優化策略各有差異。 1.詞法分析:將源碼轉換為詞法單元。 2.語法分析:生成抽象語法樹。 3.優化和編譯:通過JIT編譯器生成機器碼。 4.執行:運行機器碼。 V8引擎通過即時編譯和隱藏類優化,SpiderMonkey使用類型推斷系統,導致在相同代碼上的性能表現不同。
 超越瀏覽器:現實世界中的JavaScriptApr 12, 2025 am 12:06 AM
JavaScript在現實世界中的應用包括服務器端編程、移動應用開發和物聯網控制:1.通過Node.js實現服務器端編程,適用於高並發請求處理。 2.通過ReactNative進行移動應用開發,支持跨平台部署。 3.通過Johnny-Five庫用於物聯網設備控制,適用於硬件交互。
 使用Next.js(後端集成)構建多租戶SaaS應用程序Apr 11, 2025 am 08:23 AM
我使用您的日常技術工具構建了功能性的多租戶SaaS應用程序(一個Edtech應用程序),您可以做同樣的事情。 首先,什麼是多租戶SaaS應用程序? 多租戶SaaS應用程序可讓您從唱歌中為多個客戶提供服務
 如何使用Next.js(前端集成)構建多租戶SaaS應用程序Apr 11, 2025 am 08:22 AM
本文展示了與許可證確保的後端的前端集成,並使用Next.js構建功能性Edtech SaaS應用程序。 前端獲取用戶權限以控制UI的可見性並確保API要求遵守角色庫
 JavaScript:探索網絡語言的多功能性Apr 11, 2025 am 12:01 AM
JavaScript是現代Web開發的核心語言,因其多樣性和靈活性而廣泛應用。 1)前端開發:通過DOM操作和現代框架(如React、Vue.js、Angular)構建動態網頁和單頁面應用。 2)服務器端開發:Node.js利用非阻塞I/O模型處理高並發和實時應用。 3)移動和桌面應用開發:通過ReactNative和Electron實現跨平台開發,提高開發效率。
 JavaScript的演變:當前的趨勢和未來前景Apr 10, 2025 am 09:33 AM
JavaScript的最新趨勢包括TypeScript的崛起、現代框架和庫的流行以及WebAssembly的應用。未來前景涵蓋更強大的類型系統、服務器端JavaScript的發展、人工智能和機器學習的擴展以及物聯網和邊緣計算的潛力。
 神秘的JavaScript:它的作用以及為什麼重要Apr 09, 2025 am 12:07 AM
JavaScript是現代Web開發的基石,它的主要功能包括事件驅動編程、動態內容生成和異步編程。 1)事件驅動編程允許網頁根據用戶操作動態變化。 2)動態內容生成使得頁面內容可以根據條件調整。 3)異步編程確保用戶界面不被阻塞。 JavaScript廣泛應用於網頁交互、單頁面應用和服務器端開發,極大地提升了用戶體驗和跨平台開發的靈活性。
 Python還是JavaScript更好?Apr 06, 2025 am 12:14 AM
Python更适合数据科学和机器学习,JavaScript更适合前端和全栈开发。1.Python以简洁语法和丰富库生态著称,适用于数据分析和Web开发。2.JavaScript是前端开发核心,Node.js支持服务器端编程,适用于全栈开发。


熱AI工具

Undresser.AI Undress
人工智慧驅動的應用程序,用於創建逼真的裸體照片

AI Clothes Remover
用於從照片中去除衣服的線上人工智慧工具。

Undress AI Tool
免費脫衣圖片

Clothoff.io
AI脫衣器

AI Hentai Generator
免費產生 AI 無盡。

熱門文章
熱工具

VSCode Windows 64位元 下載
微軟推出的免費、功能強大的一款IDE編輯器

SublimeText3 Linux新版
SublimeText3 Linux最新版

ZendStudio 13.5.1 Mac
強大的PHP整合開發環境

SublimeText3 英文版
推薦:為Win版本,支援程式碼提示!

Atom編輯器mac版下載
最受歡迎的的開源編輯器

