


介紹
Snowflake 發布了名為 Snowflake Copilot 的 LLM 助理功能作為預覽功能。使用 Snowflake Copilot,您可以使用自然語言分析表格資料。
另一方面,Snowflake (SiS) 中的 Streamlit 可讓您輕鬆整合生成式 AI 並安全地存取表格資料。這讓我思考:我們是否可以創造一個更主動的自然語言資料分析工具?因此,我開發了一個可以使用自然語言分析和視覺化資料的應用程式。
註:本文僅代表個人觀點,不代表Snowflake。
功能概述
目標
- 可供不熟悉 SQL 的業務使用者使用
- 能夠透過滑鼠操作選擇資料庫/模式/表進行分析
- 能夠分析非常模糊的自然語言查詢
實際截圖(節錄)
以下是使用 Cortex LLM (snowflake-arctic) 的分析結果摘錄。
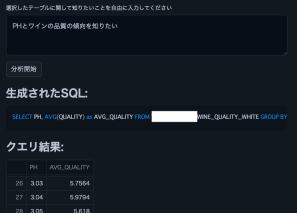

注意:我們使用了這個葡萄酒品質資料集。
功能列表
- 選擇 Cortex LLM 進行分析
- 選擇資料庫/模式/表格進行分析
- 顯示所選表格的列資訊和樣本資料
- 使用使用者的自然語言輸入進行分析
- 自動產生 SQL 進行分析
- 自動執行產生的SQL
- SQL查詢執行結果的顯示
- Cortex LLM 提供的資料洞察
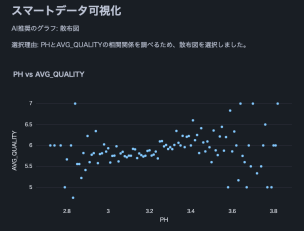
- 資料視覺化
- Cortex LLM 進行適當的圖表選擇和顯示
- Cortex LLM 的最終數據解釋
操作條件
- 可存取 Cortex LLM 的 Snowflake 帳戶
- snowflake-ml-python 1.1.2 或更高版本
防範措施
- 使用大型資料集時要小心,因為沒有設定資料限制
- 產生的 SQL 查詢的大型結果集可能需要一些時間來處理
- 大型結果集可能會導致 LLM 令牌限制錯誤
原始碼
from snowflake.snowpark.context import get_active_session
import streamlit as st
from snowflake.cortex import Complete as CompleteText
import snowflake.snowpark.functions as F
import pandas as pd
import numpy as np
import json
import plotly.express as px

# Get current session
session = get_active_session()

# Application title
st.title("Natural Language Data Analysis App")

# Cortex LLM settings
st.sidebar.title("Cortex LLM Settings")
lang_model = st.sidebar.radio("Select the language model you want to use",
                              ("snowflake-arctic", "reka-flash", "reka-core",
                               "mistral-large2", "mistral-large", "mixtral-8x7b", "mistral-7b",
                               "llama3.1-405b", "llama3.1-70b", "llama3.1-8b",
                               "llama3-70b", "llama3-8b", "llama2-70b-chat",
                               "jamba-instruct", "gemma-7b")
)

# Function to escape column names
def escape_column_name(name):
    return f'"{name}"'

# Function to get table information
def get_table_info(database, schema, table):
    # Get column information
    columns = session.sql(f"DESCRIBE TABLE {database}.{schema}.{table}").collect()

    # Create DataFrame
    column_df = pd.DataFrame(columns)

    # Get row count
    row_count = session.sql(f"SELECT COUNT(*) as count FROM {database}.{schema}.{table}").collect()[0]['COUNT']

    # Get sample data
    sample_data = session.sql(f"SELECT * FROM {database}.{schema}.{table} LIMIT 5").collect()
    sample_df = pd.DataFrame(sample_data)

    return column_df, row_count, sample_df

# Data analysis function
def analyze(df, query):
    st.subheader("Result Analysis")

    # Display basic statistical information
    st.subheader("Basic Statistics")
    st.write(df.describe())

    # Use AI for data analysis
    analysis_prompt = f"""
    Based on the following dataframe and original question, please perform data analysis.
    Concisely explain in English the insights, trends, and anomalies derived from the data.
    If possible, please also mention the following points:
    1. Data distribution and characteristics
    2. Presence of abnormal values or outliers
    3. Correlations between columns (if there are multiple numeric columns)
    4. Time-series trends (if there is date or time data)
    5. Category-specific features (if data can be divided by categories)

    Dataframe:
    {df.to_string()}

    Original question:
    {query}
    """

    analysis = CompleteText(lang_model, analysis_prompt)
    st.write(analysis)

# Data visualization function
def smart_data_visualization(df):
    st.subheader("Smart Data Visualization")

    if df.empty:
        st.warning("The dataframe is empty. There is no data to visualize.")
        return

    # Request AI for graph suggestion
    columns_info = "\n".join([f"{col} - type: {df[col].dtype}" for col in df.columns])
    sample_data = df.head().to_string()

    visualization_prompt = f"""
    Analyze the information of the following dataframe and suggest the most appropriate graph type and the columns to use for its x-axis and y-axis.
    Consider the characteristics of the data to ensure a meaningful visualization.

    Column information:
    {columns_info}

    Sample data:
    {sample_data}

    Please provide only the following JSON data format as your response:
    {{
        "graph_type": "One of: scatter plot, bar chart, line chart, histogram, box plot",
        "x_axis": "Column name to use for x-axis",
        "y_axis": "Column name to use for y-axis (if applicable)",
        "explanation": "Brief explanation of the selection reason"
    }}
    """

    ai_suggestion = CompleteText(lang_model, visualization_prompt)

    try:
        suggestion = json.loads(ai_suggestion)
        graph_type = suggestion['graph_type']
        x_axis = suggestion['x_axis']
        y_axis = suggestion.get('y_axis')  # y-axis might not be needed in some cases
        explanation = suggestion['explanation']

        st.write(f"AI recommended graph: {graph_type}")
        st.write(f"Selection reason: {explanation}")

        if graph_type == "scatter plot":
            fig = px.scatter(df, x=x_axis, y=y_axis, title=f"{x_axis} vs {y_axis}")
        elif graph_type == "bar chart":
            fig = px.bar(df, x=x_axis, y=y_axis, title=f"{y_axis} by {x_axis}")
        elif graph_type == "line chart":
            fig = px.line(df, x=x_axis, y=y_axis, title=f"{y_axis} over {x_axis}")
        elif graph_type == "histogram":
            fig = px.histogram(df, x=x_axis, title=f"Distribution of {x_axis}")
        elif graph_type == "box plot":
            fig = px.box(df, x=x_axis, y=y_axis, title=f"Distribution of {y_axis} by {x_axis}")
        else:
            st.warning(f"Unsupported graph type: {graph_type}")
            return

        st.plotly_chart(fig)

    except json.JSONDecodeError:
        st.error("Failed to parse AI suggestion. Please try again.")
    except KeyError as e:
        st.error(f"AI suggestion is missing necessary information: {str(e)}")
    except Exception as e:
        st.error(f"An error occurred while creating the graph: {str(e)}")

    # AI interpretation of visualization
    visualization_interpretation_prompt = f"""
    Based on the following dataset and created graph, please provide a detailed interpretation of the data trends and characteristics in English.
    Point out possible insights, patterns, anomalies, or areas that require additional analysis.

    Dataset information:
    Columns: {', '.join(df.columns)}
    Number of rows: {len(df)}

    Created graph:
    Type: {graph_type}
    X-axis: {x_axis}
    Y-axis: {y_axis if y_axis else 'None'}
    """

    ai_interpretation = CompleteText(lang_model, visualization_interpretation_prompt)
    st.subheader("AI Interpretation of the Graph")
    st.write(ai_interpretation)

# Function to handle cases where AI response is not just SQL query
def clean_sql_query(query):
    # Remove leading and trailing whitespace
    query = query.strip()
    # If not starting with SQL keywords, remove everything up to the first SELECT
    if not query.upper().startswith(('SELECT')):
        keywords = ['SELECT']
        for keyword in keywords:
            if keyword in query.upper():
                query = query[query.upper().index(keyword):]
                break
    return query

# Function for natural language querying of DB
def data_analysis_and_natural_language_query():
    # Database selection
    databases = session.sql("SHOW DATABASES").collect()
    database_names = [row['name'] for row in databases]
    selected_database = st.selectbox("Select a database", database_names)

    if selected_database:
        # Schema selection
        schemas = session.sql(f"SHOW SCHEMAS IN DATABASE {selected_database}").collect()
        schema_names = [row['name'] for row in schemas]
        selected_schema = st.selectbox("Select a schema", schema_names)

        if selected_schema:
            # Table selection
            tables = session.sql(f"SHOW TABLES IN {selected_database}.{selected_schema}").collect()
            table_names = [row['name'] for row in tables]
            selected_table = st.selectbox("Select a table", table_names)

            if selected_table:
                # Get table information
                column_df, row_count, sample_df = get_table_info(selected_database, selected_schema, selected_table)

                st.subheader("Table Information")
                st.write(f"Table name: `{selected_database}.{selected_schema}.{selected_table}`")
                st.write(f"Total rows: **{row_count:,}**")

                st.subheader("Column Information")
                st.dataframe(column_df)

                st.subheader("Sample Data (showing only 5 rows)")
                st.dataframe(sample_df)

                # Stringify table information (for AI)
                table_info = f"""
                Table name: {selected_database}.{selected_schema}.{selected_table}
                Total rows: {row_count}

                Column information:
                {column_df.to_string(index=False)}
                Sample data:
                {sample_df.to_string(index=False)}
                """

                # Natural language input from user
                user_query = st.text_area("Enter what you want to know about the selected table")

                if st.button("Start Analysis"):
                    if user_query:
                        # Use AI to generate SQL
                        prompt = f"""
                        Based on the following table information and question, please generate an appropriate SQL query.
                        Return only the generated SQL query without any additional response.

                        Table information:
                        {table_info}

                        Question: {user_query}

                        Notes:
                        - Follow Snowflake SQL syntax.
                        - Use aggregate functions to keep the query result size manageable.
                        - Use {selected_database}.{selected_schema}.{selected_table} as the table name.
                        """

                        generated_sql = CompleteText(lang_model, prompt)
                        generated_sql = clean_sql_query(generated_sql)
                        st.subheader("Generated SQL:")
                        st.code(generated_sql, language='sql')

                        try:
                            # Execute the generated SQL
                            result = session.sql(generated_sql).collect()
                            df = pd.DataFrame(result)

                            st.subheader("Query Result:")
                            st.dataframe(df)

                            # Analyze results
                            analyze(df, user_query)

                            # Smart data visualization
                            smart_data_visualization(df)

                        except Exception as e:
                            st.error(f"An error occurred while executing the query: {str(e)}")
                    else:
                        st.warning("Please enter a question.")

# Execution part
data_analysis_and_natural_language_query()
結論
無需 SQL 或 Python 知識即可使用自然語言輕鬆分析表格資料的能力可以顯著拓寬企業中業務使用者的資料利用範圍。透過新增連接多個表格或增加視覺化圖表的種類等功能,甚至可以執行更複雜的分析。我鼓勵大家嘗試使用 Snowflake 中的 Streamlit 來實現資料分析民主化。
公告
Snowflake 最新動態 X 更新
我正在分享 Snowflake 在 X 上的最新動態。如果您有興趣,請隨時關注!
英文版
雪花新鮮事機器人(英文版)
https://x.com/snow_new_en
日文版
雪花What's New Bot(日文版)
https://x.com/snow_new_jp
變更歷史記錄
(20240914) 初始貼文
日本原創文章
https://zenn.dev/tsubasa_tech/articles/2608c820294860
以上是嘗試使用 Snowflake (SiS) 中的 Streamlit 進行自然語言資料分析的詳細內容。更多資訊請關注PHP中文網其他相關文章!

 Python:自動化,腳本和任務管理Apr 16, 2025 am 12:14 AM
Python在自動化、腳本編寫和任務管理中表現出色。 1)自動化:通過標準庫如os、shutil實現文件備份。 2)腳本編寫:使用psutil庫監控系統資源。 3)任務管理:利用schedule庫調度任務。 Python的易用性和豐富庫支持使其在這些領域中成為首選工具。
 Python和時間:充分利用您的學習時間Apr 14, 2025 am 12:02 AM
要在有限的時間內最大化學習Python的效率,可以使用Python的datetime、time和schedule模塊。 1.datetime模塊用於記錄和規劃學習時間。 2.time模塊幫助設置學習和休息時間。 3.schedule模塊自動化安排每週學習任務。
 Python:遊戲,Guis等Apr 13, 2025 am 12:14 AM
Python在遊戲和GUI開發中表現出色。 1)遊戲開發使用Pygame,提供繪圖、音頻等功能,適合創建2D遊戲。 2)GUI開發可選擇Tkinter或PyQt,Tkinter簡單易用,PyQt功能豐富,適合專業開發。
 Python vs.C:申請和用例Apr 12, 2025 am 12:01 AM
Python适合数据科学、Web开发和自动化任务,而C 适用于系统编程、游戏开发和嵌入式系统。Python以简洁和强大的生态系统著称,C 则以高性能和底层控制能力闻名。
 2小時的Python計劃:一種現實的方法Apr 11, 2025 am 12:04 AM
2小時內可以學會Python的基本編程概念和技能。 1.學習變量和數據類型,2.掌握控制流(條件語句和循環),3.理解函數的定義和使用,4.通過簡單示例和代碼片段快速上手Python編程。
 Python:探索其主要應用程序Apr 10, 2025 am 09:41 AM
Python在web開發、數據科學、機器學習、自動化和腳本編寫等領域有廣泛應用。 1)在web開發中,Django和Flask框架簡化了開發過程。 2)數據科學和機器學習領域,NumPy、Pandas、Scikit-learn和TensorFlow庫提供了強大支持。 3)自動化和腳本編寫方面,Python適用於自動化測試和系統管理等任務。
 您可以在2小時內學到多少python?Apr 09, 2025 pm 04:33 PM
兩小時內可以學到Python的基礎知識。 1.學習變量和數據類型,2.掌握控制結構如if語句和循環,3.了解函數的定義和使用。這些將幫助你開始編寫簡單的Python程序。
 如何在10小時內通過項目和問題驅動的方式教計算機小白編程基礎?Apr 02, 2025 am 07:18 AM
如何在10小時內教計算機小白編程基礎?如果你只有10個小時來教計算機小白一些編程知識,你會選擇教些什麼�...


熱AI工具

Undresser.AI Undress
人工智慧驅動的應用程序,用於創建逼真的裸體照片

AI Clothes Remover
用於從照片中去除衣服的線上人工智慧工具。

Undress AI Tool
免費脫衣圖片

Clothoff.io
AI脫衣器

AI Hentai Generator
免費產生 AI 無盡。

熱門文章
熱工具

DVWA
Damn Vulnerable Web App (DVWA) 是一個PHP/MySQL的Web應用程序,非常容易受到攻擊。它的主要目標是成為安全專業人員在合法環境中測試自己的技能和工具的輔助工具,幫助Web開發人員更好地理解保護網路應用程式的過程,並幫助教師/學生在課堂環境中教授/學習Web應用程式安全性。 DVWA的目標是透過簡單直接的介面練習一些最常見的Web漏洞,難度各不相同。請注意,該軟體中

SublimeText3漢化版
中文版,非常好用

MantisBT
Mantis是一個易於部署的基於Web的缺陷追蹤工具,用於幫助產品缺陷追蹤。它需要PHP、MySQL和一個Web伺服器。請查看我們的演示和託管服務。

SublimeText3 英文版
推薦:為Win版本,支援程式碼提示!

mPDF
mPDF是一個PHP庫,可以從UTF-8編碼的HTML產生PDF檔案。原作者Ian Back編寫mPDF以從他的網站上「即時」輸出PDF文件,並處理不同的語言。與原始腳本如HTML2FPDF相比,它的速度較慢,並且在使用Unicode字體時產生的檔案較大,但支援CSS樣式等,並進行了大量增強。支援幾乎所有語言,包括RTL(阿拉伯語和希伯來語)和CJK(中日韓)。支援嵌套的區塊級元素(如P、DIV),

