


Introduction
Practice makes perfect.
Something that has a lot in common with being a data scientist. Theory is only one aspect of the equation; the most crucial aspect is putting theory into practice. I will make an effort to record today's entire process of developing my capstone project, which will involve studying a movie dataset.
These are the objectives:
Objective:
- Download a movie dataset from Kaggle or retrieve it using the TMDb API.
- Explore various aspects such as movie genres, ratings, director popularity, and release year trends.
- Create dashboards that visualize these trends and optionally recommend movies based on user preferences.
1. Data Collection
I decided to use Kaggle to find my dataset.It is crucial to keep in mind the crucial variables you will want for the dataset you are working with. Importantly, my dataset ought to include the following: trends in release year, popularity of directors, ratings, and movie genres. As a result, I must make sure the dataset I choose has the following, at the very least.
My dataset was located on Kaggle, and I'll provide the link below. You can obtain the CSV version of the file by downloading the dataset, unzipping it, and extracting it. You can look over it to comprehend what you already have and to truly realize what kinds of insights you hope to obtain from the data you will be examining.
2. Describing the data
First, we must import the required libraries and load the necessary data. I'm using the Python programming language and Jupyter Notebooks for my project so that I can write and see my code more efficiently.
You will import the libraries that we will be using and load the data as shown below.

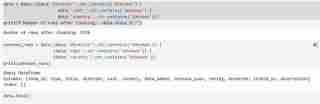
We will then run the following command to get more details about our dataset.
data.head() # dispalys the first rows of the dataset.
data.tail() # displays the last rows of the dataset.
data.shape # Shows the total number of rows and columns.
len(data.columns)  # Shows the total number of columns.
data.columns # Describes different column names.
data.dtypes # Describes different data types.
We now know what the dataset comprises and the insights we hope to extract after obtaining all the descriptions we require. Example: Using my dataset, I wish to investigate patterns in the popularity of directors, ratings distribution, and movie genres. I also want to suggest movies depending on user-selected preferences, such as preferred directors and genres.
3. Data Cleaning
This phase involves finding any null values and removing them. In order to move on with data visualization, we will also examine our dataset for duplicates and remove any that we find. To do this, we'll run the code that follows:
1. data['show_id'].value_counts().sum() # Checks for the total number of rows in my dataset
2. data.isna().sum() # Checks for null values(I found null values in director, cast and country columns)
3. data[['director', 'cast', 'country']] = data[['director', 'cast', 'country']].replace(np.nan, "Unknown ") # Fill null values with unknown.
We will then drop the rows with unknown values and confirm we have dropped all of them. We will also check the number of rows remaining that have cleaned data.
The code that follows looks for unique characteristics and duplicates. Although there are no duplicates in my dataset, you might still need to utilize it in case future datasets do.
data.duplicated().sum() # Checks for duplicates
data.nunique() # Checks for unique features
data.info # Confirms if nan values are present and also shows datatypes.
My date/time data type is an object and I would like for it to be in the proper date/time format so I used
data['date_added']=data['date_added'].astype('datetime64[ms]')to convert it to the proper format.
4. Data Visualization
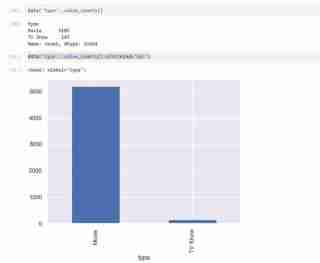
My dataset has two types of variables namely the TV shows and Movies in the types and I used a bar graph to present the categorical data with the values that they represent.

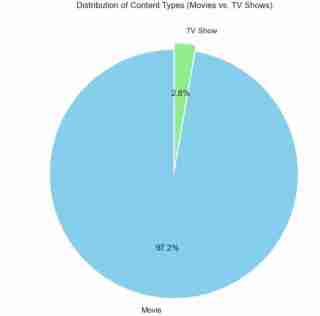
I also used a pie chart to represent the same as above. The code used is as follows and the outcome expected shown below.
## Pie chart display
plt.figure(figsize=(8, 8))
data['type'].value_counts().plot(
    kind='pie',
    autopct='%1.1f%%',
    colors=['skyblue', 'lightgreen'],
    startangle=90,
    explode=(0.05, 0)
)
plt.title('Distribution of Content Types (Movies vs. TV Shows)')
plt.ylabel('')
plt.show()
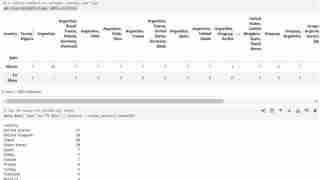
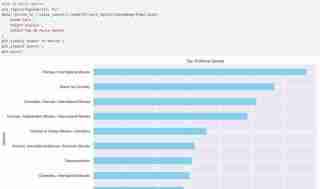
- I then did a tabled comparison using pd.crosstab(data.type, data.country) to create a tabled comparison of the types based on release dates, countries, and other factors (you can try changing the columns in the code independently). Below are the code to use and the expected comparison. I also checked the first 20 countries leading in the production of Tv Shows and and visualized them in a bar graph.You can copy the code in the image and ensure the outcome is almost similar to mine.

- I then checked for the top 10 movie genre as shown below. You can also use the code to check for TV shows. Just substitute with proper variable names.
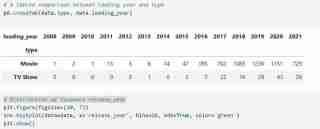
- I extracted months and years separately from the dates provided so that I could visualize some histogram plots over the years.


- Checked for the top 10 directors with the most movies and compared them using a bar graph.

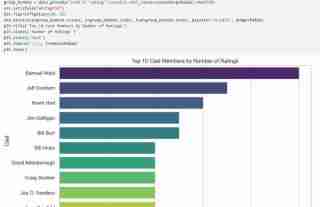
- Checked for the cast with the highest rating and visualized them.
5. Recommendation System
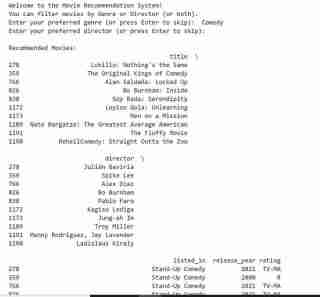
I then built a recommendation system that takes in genre or director's name as input and produces a list of movies as per the user's preference. If the input cannot be matched by the algorithm then the user is notified.
The code for the above is as follows:
def recommend_movies(genre=None, director=None):
    recommendations = data
    if genre:
        recommendations = recommendations[recommendations['listed_in'].str.contains(genre, case=False, na=False)]
    if director:
        recommendations = recommendations[recommendations['director'].str.contains(director, case=False, na=False)]
    if not recommendations.empty:
        return recommendations[['title', 'director', 'listed_in', 'release_year', 'rating']].head(10)
    else:
        return "No movies found matching your preferences."
print("Welcome to the Movie Recommendation System!")
print("You can filter movies by Genre or Director (or both).")
user_genre = input("Enter your preferred genre (or press Enter to skip): ")
user_director = input("Enter your preferred director (or press Enter to skip): ")
recommendations = recommend_movies(genre=user_genre, director=user_director)
print("\nRecommended Movies:")
print(recommendations)
Conclusion
My goals were achieved, and I had a great time taking on this challenge since it helped me realize that, even though learning is a process, there are days when I succeed and fail. This was definitely a success. Here, we celebrate victories as well as defeats since, in the end, each teach us something. Do let me know if you attempt this.
Till next time!
Note!!
The code is in my GitHub:
https://github.com/MichelleNjeri-scientist/Movie-Dataset-Exploration-and-Visualization
The Kaggle dataset is:
https://www.kaggle.com/datasets/shivamb/netflix-shows
以上是電影資料集探索與視覺化的詳細內容。更多資訊請關注PHP中文網其他相關文章!

 Python vs.C:申請和用例Apr 12, 2025 am 12:01 AM
Python适合数据科学、Web开发和自动化任务,而C 适用于系统编程、游戏开发和嵌入式系统。Python以简洁和强大的生态系统著称,C 则以高性能和底层控制能力闻名。
 2小時的Python計劃:一種現實的方法Apr 11, 2025 am 12:04 AM
2小時內可以學會Python的基本編程概念和技能。 1.學習變量和數據類型,2.掌握控制流(條件語句和循環),3.理解函數的定義和使用,4.通過簡單示例和代碼片段快速上手Python編程。
 Python:探索其主要應用程序Apr 10, 2025 am 09:41 AM
Python在web開發、數據科學、機器學習、自動化和腳本編寫等領域有廣泛應用。 1)在web開發中,Django和Flask框架簡化了開發過程。 2)數據科學和機器學習領域,NumPy、Pandas、Scikit-learn和TensorFlow庫提供了強大支持。 3)自動化和腳本編寫方面,Python適用於自動化測試和系統管理等任務。
 您可以在2小時內學到多少python?Apr 09, 2025 pm 04:33 PM
兩小時內可以學到Python的基礎知識。 1.學習變量和數據類型,2.掌握控制結構如if語句和循環,3.了解函數的定義和使用。這些將幫助你開始編寫簡單的Python程序。
 如何在10小時內通過項目和問題驅動的方式教計算機小白編程基礎?Apr 02, 2025 am 07:18 AM
如何在10小時內教計算機小白編程基礎?如果你只有10個小時來教計算機小白一些編程知識,你會選擇教些什麼�...
 如何在使用 Fiddler Everywhere 進行中間人讀取時避免被瀏覽器檢測到?Apr 02, 2025 am 07:15 AM
使用FiddlerEverywhere進行中間人讀取時如何避免被檢測到當你使用FiddlerEverywhere...
 Python 3.6加載Pickle文件報錯"__builtin__"模塊未找到怎麼辦?Apr 02, 2025 am 07:12 AM
Python3.6環境下加載Pickle文件報錯:ModuleNotFoundError:Nomodulenamed...
 如何提高jieba分詞在景區評論分析中的準確性?Apr 02, 2025 am 07:09 AM
如何解決jieba分詞在景區評論分析中的問題?當我們在進行景區評論分析時,往往會使用jieba分詞工具來處理文�...


熱AI工具

Undresser.AI Undress
人工智慧驅動的應用程序,用於創建逼真的裸體照片

AI Clothes Remover
用於從照片中去除衣服的線上人工智慧工具。

Undress AI Tool
免費脫衣圖片

Clothoff.io
AI脫衣器

AI Hentai Generator
免費產生 AI 無盡。

熱門文章
熱工具

MantisBT
Mantis是一個易於部署的基於Web的缺陷追蹤工具,用於幫助產品缺陷追蹤。它需要PHP、MySQL和一個Web伺服器。請查看我們的演示和託管服務。

Dreamweaver Mac版
視覺化網頁開發工具

ZendStudio 13.5.1 Mac
強大的PHP整合開發環境

MinGW - Minimalist GNU for Windows
這個專案正在遷移到osdn.net/projects/mingw的過程中,你可以繼續在那裡關注我們。 MinGW:GNU編譯器集合(GCC)的本機Windows移植版本,可自由分發的導入函式庫和用於建置本機Windows應用程式的頭檔;包括對MSVC執行時間的擴展,以支援C99功能。 MinGW的所有軟體都可以在64位元Windows平台上運作。

SublimeText3漢化版
中文版,非常好用

