


注意:在這篇文章中,我們將僅使用灰階影像以使其易於理解。
什麼是圖像?
影像可以被認為是值的矩陣,其中每個值代表像素的強度。影像格式主要分為三種:
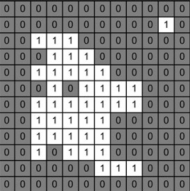
- 二進位:此格式的影像由值為 0(黑色)和 1(白色)的單一二維矩陣表示。這是最簡單的圖像表示形式。
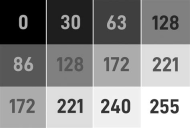
- Grey-Scale:在此格式中,影像由值範圍為 0 到 255 的單一二維矩陣表示;其中 0 代表黑色,255 代表白色。中間值代表不同的灰色深淺。
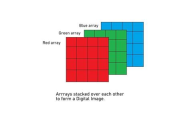
- RGB Scale:這裡,影像由三個二維矩陣表示(每個顏色通道一個:紅色、綠色和藍色),值範圍從 0 到 255。每個矩陣包含以下像素值:一個顏色分量,結合這三個通道就可以得到全彩影像。
過濾器
濾鏡是用於透過應用某些操作來修改影像的工具。濾波器是一個在影像上移動的矩陣(也稱為內核),對其視窗內的像素值執行計算。我們將介紹兩種常見類型的濾波器:均值濾波器和中值濾波器。
均值濾波器
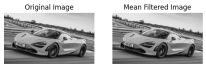
均值濾波器用於透過對視窗內的像素值進行平均來減少雜訊。它將視窗中的中心像素替換為該視窗中所有像素值的平均值。 cv2.blur() 函數應用內核大小為 3x3 的均值濾波器,這意味著它會考慮每個像素周圍的 3x3 像素視窗來計算平均值。這有助於平滑影像。
import cv2
import matplotlib.pyplot as plt

image = cv2.imread('McLaren-720S-Price-1200x675.jpg', cv2.IMREAD_GRAYSCALE)

# Applies a Mean Filter of size 3 x 3
blurred_image = cv2.blur(image, (3, 3))

plt.subplot(1, 2, 1)
plt.imshow(image, cmap='gray')
plt.title('Original Image')
plt.axis("off")

plt.subplot(1, 2, 2)
plt.imshow(blurred_image, cmap='gray')
plt.title('Mean Filtered Image')
plt.axis("off")
plt.show()

中值濾波器
中值濾波器用於透過將每個像素的值替換為視窗中所有像素的中值來減少雜訊。它對於消除椒鹽噪音特別有效。 cv2.medianBlur() 函數應用內核大小為 3 的中值濾波器。此方法將每個像素替換為其鄰域像素值的中值,這有助於在去除雜訊的同時保留邊緣。這裡,內核尺寸越大,影像越模糊。
import cv2
import matplotlib.pyplot as plt

image = cv2.imread('McLaren-720S-Price-1200x675.jpg', cv2.IMREAD_GRAYSCALE)

# Applies a Median Filter with a kernel size of 3
blurred_image = cv2.medianBlur(image, 3)

plt.subplot(1, 2, 1)
plt.imshow(image, cmap='gray')
plt.title('Original Image')
plt.axis("off")

plt.subplot(1, 2, 2)
plt.imshow(blurred_image, cmap='gray')
plt.title('Median Filtered Image')
plt.axis("off")
plt.show()
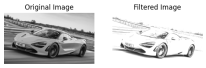
自訂過濾器
您可以建立自訂濾鏡以對影像套用特定操作。 cv2.filter2D() 函數可讓您將任何自訂核心套用至影像。 cv2.filter2D() 函數將自訂核心(濾鏡)套用到影像。內核是一個矩陣,定義對像素值執行的操作。在這個例子中,內核根據指定的值增強了影像的某些特徵。
import cv2
import numpy as np
import matplotlib.pyplot as plt

image = cv2.imread('McLaren-720S-Price-1200x675.jpg', cv2.IMREAD_GRAYSCALE)

# Define a custom filter kernel
kernel = np.array([[2, -1, 5],
                   [-5, 5, -1],
                   [0, -1, 0]])

filtered_image = cv2.filter2D(image, -1, kernel)

plt.subplot(1, 2, 1)
plt.imshow(image, cmap='gray')
plt.title('Original Image')
plt.axis('off')

plt.subplot(1, 2, 2)
plt.imshow(filtered_image, cmap='gray')
plt.title('Filtered Image')
plt.axis('off')

plt.show()
閾值化
注意:在程式碼片段中,在分配閾值影像時,您將看到 _ ,影像。這是因為 cv2.threshold 函數傳回兩個值:使用的閾值和閾值化影像。由於我們只需要閾值影像,因此我們使用 _ 來忽略閾值。
閾值處理透過根據條件設定像素值將影像轉換為二值影像。閾值技術有多種類型:
全域閾值
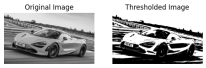
簡單閾值處理
此方法為整個影像設定一個固定的閾值。值高於閾值的像素設定為最大值 (255),低於閾值的像素設定為 0。 cv2.threshold() 函數用於簡單閾值處理。強度大於 127 的像素設定為白色 (255),強度小於或等於 127 的像素設定為黑色 (0),產生二值影像。
import cv2
import matplotlib.pyplot as plt

image = cv2.imread('McLaren-720S-Price-1200x675.jpg', cv2.IMREAD_GRAYSCALE)

_, thresholded_image = cv2.threshold(image, 127, 255, cv2.THRESH_BINARY)

plt.subplot(1, 2, 1)
plt.imshow(image, cmap='gray')
plt.title('Original Image')
plt.axis("off")

plt.subplot(1, 2, 2)
plt.imshow(thresholded_image, cmap='gray')
plt.title('Thresholded Image')
plt.axis("off")
plt.show()
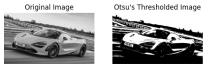
Otsu Thresholding
Otsu's method determines the optimal threshold value automatically based on the histogram of the image. This method minimizes intra-class variance and maximizes inter-class variance. By setting the threshold value to 0 and using cv2.THRESH_OTSU, the function automatically calculates the best threshold value to separate the foreground from the background.
import cv2
import matplotlib.pyplot as plt

image = cv2.imread('McLaren-720S-Price-1200x675.jpg', cv2.IMREAD_GRAYSCALE)

_, otsu_thresholded_image = cv2.threshold(image, 0, 255, cv2.THRESH_BINARY + cv2.THRESH_OTSU)

plt.subplot(1, 2, 1)
plt.imshow(image, cmap='gray')
plt.title('Original Image')
plt.axis("off")

plt.subplot(1, 2, 2)
plt.imshow(otsu_thresholded_image, cmap='gray')
plt.title("Otsu's Thresholded Image")
plt.axis("off")
plt.show()
Adaptive Thresholding
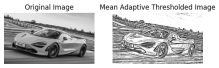
Mean Adaptive Thresholding
In Mean Adaptive Thresholding, the threshold value for each pixel is calculated based on the average of pixel values in a local neighborhood around that pixel. This method adjusts the threshold dynamically across different regions of the image. The cv2.adaptiveThreshold() function calculates the threshold for each pixel based on the mean value of the pixel values in a local 11x11 neighborhood. A constant value of 2 is subtracted from this mean to fine-tune the threshold. This method is effective for images with varying lighting conditions.
import cv2
import matplotlib.pyplot as plt

image = cv2.imread('McLaren-720S-Price-1200x675.jpg', cv2.IMREAD_GRAYSCALE)

mean_adaptive_thresholded_image = cv2.adaptiveThreshold(image, 255, cv2.ADAPTIVE_THRESH_MEAN_C, cv2.THRESH_BINARY, 11, 2)

plt.subplot(1, 2, 1)
plt.imshow(image, cmap='gray')
plt.title('Original Image')
plt.axis("off")

plt.subplot(1, 2, 2)
plt.imshow(mean_adaptive_thresholded_image, cmap='gray')
plt.title('Mean Adaptive Thresholded Image')
plt.axis("off")
plt.show()
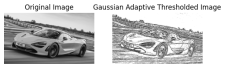
Gaussian Adaptive Thresholding
Gaussian Adaptive Thresholding computes the threshold value for each pixel based on a Gaussian-weighted sum of the pixel values in a local neighborhood. This method often provides better results in cases with non-uniform illumination. In Gaussian Adaptive Thresholding, the threshold is determined by a Gaussian-weighted sum of pixel values in an 11x11 neighborhood. The constant value 2 is subtracted from this weighted mean to adjust the threshold. This method is useful for handling images with varying lighting and shadows.
import cv2
import matplotlib.pyplot as plt

image = cv2.imread('McLaren-720S-Price-1200x675.jpg', cv2.IMREAD_GRAYSCALE)

gaussian_adaptive_thresholded_image = cv2.adaptiveThreshold(image, 255, cv2.ADAPTIVE_THRESH_GAUSSIAN_C, cv2.THRESH_BINARY, 11, 2)

plt.subplot(1, 2, 1)
plt.imshow(image, cmap='gray')
plt.title('Original Image')
plt.axis("off")

plt.subplot(1, 2, 2)
plt.imshow(gaussian_adaptive_thresholded_image, cmap='gray')
plt.title('Gaussian Adaptive Thresholded Image')
plt.axis("off")
plt.show()
References
- Encord.com
- Pyimagesearch.com
- OpenCV Thresholding
- OpenCV Filtering
以上是Python 電腦視覺簡介(第 1 部分)的詳細內容。更多資訊請關注PHP中文網其他相關文章!

 Python:深入研究彙編和解釋May 12, 2025 am 12:14 AM
pythonisehybridmodeLofCompilation和interpretation:1)thepythoninterpretercompilesourcecececodeintoplatform- interpententbybytecode.2)thepythonvirtualmachine(pvm)thenexecutecutestestestestestesthisbytecode,ballancingEaseofuseEfuseWithPerformance。
 Python是一種解釋或編譯語言,為什麼重要?May 12, 2025 am 12:09 AM
pythonisbothinterpretedAndCompiled.1)它的compiledTobyTecodeForportabilityAcrosplatforms.2)bytecodeisthenInterpreted,允許fordingfordforderynamictynamictymictymictymictyandrapiddefupment,儘管Ititmaybeslowerthananeflowerthanancompiledcompiledlanguages。
 對於python中的循環時循環與循環:解釋了關鍵差異May 12, 2025 am 12:08 AM
在您的知識之際,而foroopsareideal insinAdvance中,而WhileLoopSareBetterForsituations則youneedtoloopuntilaconditionismet
 循環時:實用指南May 12, 2025 am 12:07 AM
ForboopSareSusedwhenthentheneMberofiterationsiskNownInAdvance,而WhileLoopSareSareDestrationsDepportonAcondition.1)ForloopSareIdealForiteratingOverSequencesLikelistSorarrays.2)whileLeleLooleSuitableApeableableableableableableforscenarioscenarioswhereTheLeTheLeTheLeTeLoopContinusunuesuntilaspecificiccificcificCondond
 Python:它是真正的解釋嗎?揭穿神話May 12, 2025 am 12:05 AM
pythonisnotpuroly interpred; itosisehybridablectofbytecodecompilationandruntimeinterpretation.1)PythonCompiLessourceceCeceDintobyTecode,whitsthenexecececected bytybytybythepythepythepythonvirtirtualmachine(pvm).2)
 與同一元素的Python串聯列表May 11, 2025 am 12:08 AM
concatenateListSinpythonWithTheSamelements,使用:1)operatoTotakeEpduplicates,2)asettoremavelemavphicates,or3)listcompreanspherensionforcontroloverduplicates,每個methodhasdhasdifferentperferentperferentperforentperforentperforentperfornceandordorimplications。
 解釋與編譯語言:Python的位置May 11, 2025 am 12:07 AM
pythonisanterpretedlanguage,offeringosofuseandflexibilitybutfacingperformancelanceLimitationsInCricapplications.1)drightingedlanguageslikeLikeLikeLikeLikeLikeLikeLikeThonexecuteline-by-line,允許ImmediaMediaMediaMediaMediaMediateFeedBackAndBackAndRapidPrototypiD.2)compiledLanguagesLanguagesLagagesLikagesLikec/c thresst
 循環時:您什麼時候在Python中使用?May 11, 2025 am 12:05 AM
Useforloopswhenthenumberofiterationsisknowninadvance,andwhileloopswheniterationsdependonacondition.1)Forloopsareidealforsequenceslikelistsorranges.2)Whileloopssuitscenarioswheretheloopcontinuesuntilaspecificconditionismet,usefulforuserinputsoralgorit


熱AI工具

Undresser.AI Undress
人工智慧驅動的應用程序,用於創建逼真的裸體照片

AI Clothes Remover
用於從照片中去除衣服的線上人工智慧工具。

Undress AI Tool
免費脫衣圖片

Clothoff.io
AI脫衣器

Video Face Swap
使用我們完全免費的人工智慧換臉工具,輕鬆在任何影片中換臉!

熱門文章
熱工具

SecLists
SecLists是最終安全測試人員的伙伴。它是一個包含各種類型清單的集合,這些清單在安全評估過程中經常使用,而且都在一個地方。 SecLists透過方便地提供安全測試人員可能需要的所有列表,幫助提高安全測試的效率和生產力。清單類型包括使用者名稱、密碼、URL、模糊測試有效載荷、敏感資料模式、Web shell等等。測試人員只需將此儲存庫拉到新的測試機上,他就可以存取所需的每種類型的清單。

Dreamweaver Mac版
視覺化網頁開發工具

MinGW - Minimalist GNU for Windows
這個專案正在遷移到osdn.net/projects/mingw的過程中,你可以繼續在那裡關注我們。 MinGW:GNU編譯器集合(GCC)的本機Windows移植版本,可自由分發的導入函式庫和用於建置本機Windows應用程式的頭檔;包括對MSVC執行時間的擴展,以支援C99功能。 MinGW的所有軟體都可以在64位元Windows平台上運作。

SublimeText3 英文版
推薦:為Win版本,支援程式碼提示!

WebStorm Mac版
好用的JavaScript開發工具

