
Python靜態分析的維度

- WBOYWBOYWBOYWBOYWBOYWBOYWBOYWBOYWBOYWBOYWBOYWBOYWB原創
- 2024-07-19 06:07:20970瀏覽
Python 靜態分析,也稱為“linting”,是軟體開發的一個重要面向。它涉及在不運行 Python 程式碼的情況下檢查它,以識別潛在的錯誤、程式錯誤、風格問題或不遵守預先定義編碼標準的模式。它還有助於在開發過程的早期識別漏洞,減少將不安全程式碼部署到生產中的機會。例如,它可以發現不安全的編碼實踐,例如使用硬編碼憑證、可能導致 SQL 注入攻擊的常見錯誤或資料清理的潛在問題。
Python提供了多個用於靜態分析的函式庫和工具,例如Pylint、Pyflakes和Flake8。例如,Pylint 可以幫助執行編碼標準、偵測錯誤並檢查程式碼複雜度。這是一個簡單的程式碼片段,展示如何使用 Pylint:
# test.py

def add(x, y):
    return x + y

add(1, '2')
在其上運行 Pylint 會給出:
$ pylint test.py
************* Module test
test.py:5:4: E1136: Value '2' is unsubscriptable (unsubscriptable-object)

--------------------------------------------------
Your code has been rated at -10.00/10
當我們嘗試將整數和字串相加時,Pylint 會偵測到錯誤,這在 Python 中不是有效的操作。
1.Python靜態分析中的型別檢查
Python 是一種多功能、動態的語言,其靈活性是它深受開發人員喜愛的原因之一。然而,這種動態有時會導致難以發現的錯誤,特別是在類型錯誤方面。這就是 Python 靜態分析發揮作用的地方。
在我們深入了解類型檢查之前,讓我們先了解動態類型在 Python 中的意義。 Python 是動態類型的,這意味著在運行時檢查變數的類型,並且不需要明確指定它。下面的程式碼片段對此進行了示範:
# x is an integer
x = 5
# x is now a string
x = "Hello, World!"
雖然動態類型可以使 Python 更易於使用和閱讀,但它也可能導致類型錯誤,只有在程式碼實際運行時才會發現。
靜態型別檢查的作用
靜態類型檢查是一種在開發過程的早期(即在編碼或建置期間而不是在運行時)捕獲類型錯誤的方法。這可以防止潛在的錯誤進入生產代碼,從而增強程式碼的安全性和可靠性。靜態類型程式語言的一些範例是 Java 和 C++。
Python 雖然是一種動態類型語言,但也透過型別註釋支援可選的靜態型別。此功能可讓您註解預期的變數類型、函數參數和傳回值。 Python 運行時不會強制執行這些類型,但靜態分析工具可以使用它們來捕獲潛在的類型錯誤。
def greet(name: str) -> str:
    return 'Hello, ' + name
在此範例中,名稱應為字串,且函數也應傳回字串。
Python 中的靜態型別檢查工具
有幾個工具可以幫助在 Python 中進行靜態類型檢查。其中,Mypy、Pyright 和 Pyre 因其穩健性和在 Python 社群中的廣泛接受度而脫穎而出。
- Mypy: 一個可選的 Python 靜態類型檢查器,旨在結合動態類型和靜態類型的優點。它用途廣泛,可在 CI/CD 管道中使用,以在類型錯誤進入生產之前捕獲它們。
- Pyright: Pyright 由 Microsoft 開發,是一個專注於效能的靜態型別檢查器。它用 TypeScript 編寫並在 Node.js 上運行。
- Pyre: Pyre 是 Facebook 開發的 Python 高效能類型檢查器。它旨在透過在終端機或您最喜歡的編輯器中以互動方式標記類型錯誤來幫助提高程式碼品質和開發速度。
程式碼範例:使用 Mypy 進行類型檢查
安裝 Mypy 就像運行 pip install mypy 一樣簡單。安裝後,您可以使用它來檢查 Python 檔案是否有類型錯誤。這是一個簡單的例子:
# file: hello.py
def greet(name: str) -> str:
    return 'Hello, ' + name

# This will cause a type error
greet(123)
您可以使用 Mypy 檢查此文件,如下所示:
$ mypy hello.py
hello.py:5: error: Argument 1 to "greet" has incompatible type "int"; expected "str"
Found 1 error in 1 file (checked 1 source file)
如您所見,Mypy 在程式碼運行之前就捕獲了類型錯誤。
2.Python靜態分析中的Linter
Linter 是靜態程式碼分析工具,用於標記程式設計錯誤、錯誤、風格錯誤和可疑結構。在 Python 環境中,linter 在維護程式碼的品質和安全性方面發揮著至關重要的作用。它們有助於執行編碼標準,在開發過程的早期檢測潛在的錯誤和安全漏洞,並提高 Python 程式碼的整體可讀性和可維護性。
在 Python 生態系中,一些最廣泛使用的 linter 是 Pylint、Flake8 和 Pyflakes。
- Pylint: Pylint is a highly configurable, open-source tool that checks for errors in Python code, enforces a coding standard, and looks for code smells. Pylint can also be used to write custom plugins for specific use cases.
- Flake8: Flake8 is a Python library that wraps PyFlakes, pycodestyle, and Ned Batchelder’s McCabe script. It is a great toolkit that checks your project for compliance with PEP 8, Python’s style guide.
- Pyflakes: Pyflakes checks Python source files for errors quickly but without executing them. It's faster than Pylint and Flake8 because it doesn't enforce style guides, making it a good option for a quick, basic check of your Python code.
The concept of code smells and enforcing coding standards
Code smells are indicators of deeper problems with your code. They are patterns in code that suggest violations of fundamental design principles and negatively impact design quality. Some common examples of code smells in Python include large classes, long method, duplicate code, and dead code.
Linters like Pylint, Flake8, and Pyflakes help detect such code smells and enforce coding standards in your Python code to improve code quality and keep it at an acceptable standard. They do this by checking your code against pre-defined rules and guidelines, which are often based on community-adopted best practices such as PEP 8 for Python.
Code example demonstrating a linter in action
Here's an example of how to use Pylint to perform static analysis on a Python file named example.py:
# example.py
def add(a, b):
    return a+b
To run Pylint on this file, you would use the following command:
pylint example.py
If there are any issues with your code, Pylint will flag them and provide a detailed report. For example, it might highlight that the function add is missing function docstring, which is a violation of PEP 8's guidelines for writing good Python code.
Custom rules in linters
Linters like Pylint allow you to define custom rules for your Python projects. This is particularly useful when you have specific coding standards or guidelines that are unique to your project or organization.
Creating a custom rule in Pylint involves creating a Python class that extends from one of Pylint’s checker classes and then defining methods that perform the actual checking of the code. Once you've defined your custom rules, you can then add them to your Pylint checker using the register_checker method.
Here's a simple example of a custom Pylint rule that checks for the use of the print statement:
from pylint.checkers import BaseChecker
from pylint.interfaces import IAstroidChecker

class NoPrintStatementsChecker(BaseChecker):
    __implements__ = IAstroidChecker
    name = 'no-print-statements'
    msgs = {
        'W0001': (
            'Print statement used',
            'no-print-statements',
            'Print statements should not be used',
        ),
    }

    def visit_print(self, node):
        self.add_message('no-print-statements', node=node)

def register(linter):
    linter.register_checker(NoPrintStatementsChecker(linter))
In this example, the NoPrintStatementsChecker class checks for the use of the print statement and raises a warning if it finds one. The register function is then used to register this custom checker with Pylint.
3. Security vulnerability detection
One of the critical dimensions of Python static analysis is security vulnerability detection. Let's break down the importance of security in Python static analysis, common security risks in Python code, and a few tools you can use for security vulnerability detection, such as Bandit and Snyk Code.
When you write Python code, security should not be an afterthought but an integral part of the development process. Python static analysis plays a crucial role in ensuring code security, as it can help identify potential security vulnerabilities at an early stage of the development cycle, even before the code execution. Vulnerabilities such as injection attacks, insecure direct object references, security misconfigurations, and cross-site scripting are prevalent in Python code.
For instance, an SQL injection vulnerability in Python code might look like this:
def get_user_details(user_id):
    return database.execute(f'SELECT * FROM users WHERE id = {user_id}')
In the above example, the user_id is directly used in a SQL query, which opens up the possibility for SQL injection if the user_id is not properly sanitized and is provided by the user.
Tools for security vulnerability detection
Bandit
Bandit is a tool designed to find common security issues in Python code. It processes each file, builds an AST (Abstract Syntax Tree) from the Python code, and runs appropriate plugins against the AST nodes.
Here's how you can use Bandit to scan your Python code for security vulnerabilities:
$ bandit -r path/to/your/python/code
Would Bandit find an insecure direct object reference in Python? Unsure? read more about Snyk next.
Snyk Code
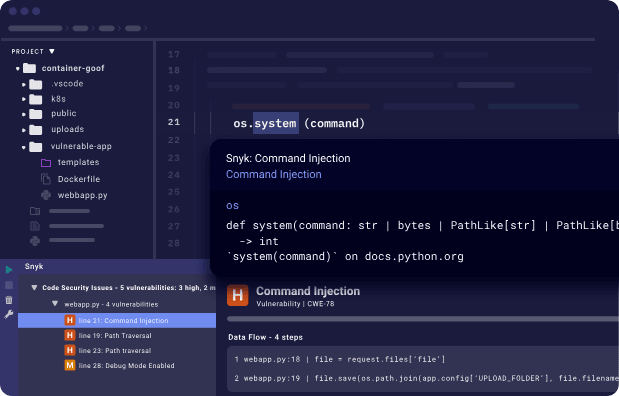
Snyk Code is another tool that provides a fast, symbolic AI-powered analysis engine. With Snyk Code, you can quickly find security vulnerabilities in your Python code. Snyk Code's static analysis engine is designed to understand the context and flow of your code, enabling it to detect complex security vulnerabilities that other tools might miss.
Snyk Code also comes with a PyCharm IDE plugin, allowing developers to detect and fix security issues in real time as they code.
To get started with Snyk Code, you simply need to download the PyCharm IDE plugin for Snyk, and you can start using it for free.
Implementing security vulnerability detection as part of your Python static analysis is crucial in ensuring the security of your software. Tools like Bandit and Snyk Code provide developers with an easy and efficient way to detect and fix security vulnerabilities in their Python code.
4. Code complexity analysis
Code complexity is a metric that is used to gauge how hard your code is to understand or modify. Higher complexity often translates to increased difficulty in comprehending the code, which in turn affects the code's maintainability.
Maintaining code is a regular part of a developer's job, but when the codebase becomes complex, it becomes increasingly challenging to understand and modify. This issue can lead to bugs and decrease the overall quality of the software. As a result, code complexity analysis is crucial in software development to ensure high-quality, maintainable code.
Cyclomatic complexity measurement with radon
To measure code complexity in Python, one can use various tools, and one of such is Radon. Radon is a Python tool that computes various metrics from the information extracted from the Abstract Syntax Tree (AST). One of these metrics is the Cyclomatic Complexity.
Cyclomatic Complexity is a software metric used to indicate the complexity of a program. It is a quantitative measure of the number of linearly independent paths through a program's source code. Radon analyzes your Python code and gives it a rank from A to F, where A means the code is simple and easy to understand, while F signifies it's too complex.
To use Radon, you need to install it first. You can install it using pip:
pip install radon
Code example demonstrating code complexity analysis
After installing Radon, you can use it to analyze your Python code. Let's consider the following Python code:
def calculate_sum(n):
    if n < 0:
        return "Negative number"
    else:
        return sum(range(n+1))
To measure the complexity of the above code, you would run the following command:
radon cc your_file.py
This command will return the cyclomatic complexity of the code. The complexity of the above code is 2, which means it is not very complex.
But if we look at a more complex function, for example:
def complex_function(a, b, c):
    if a > b:
        if a > c:
            return a
        else:
            return c
    else:
        if b > c:
            return b
        else:
            return c
Running Radon on this code would return a complexity of 5, indicating a higher level of complexity.
Using cyclomatic complexity tools helps maintain the quality of the code, making it easier to understand and modify. Tools like Radon provide a simple way to measure code complexity in Python, thus making your code more maintainable and less prone to bugs.
5. Dependency analysis
In the world of open source software taking a pillar step in software development, dependency analysis is a significant aspect that developers cannot afford to overlook. This procedure is crucial when dealing with large codebases in languages such as Python. Dependency analysis involves the identification of dependencies between different elements in a software project. Let's explore the importance of understanding and managing dependencies, tools for dependency analysis like Snyk and the Snyk Advisor, and a practical example showcasing dependency analysis in action.
Importance of understanding and managing dependencies
In Python projects, dependencies are the external packages or libraries that your project uses. These could range from web frameworks like Django or Flask to data science libraries like NumPy or pandas.
Understanding and managing dependencies is crucial for several reasons:
- It helps maintain the stability and reliability of your software. If a dependency that your project relies on has a bug or breaks, your software could also break.
- It assists in improving the security of your project. Dependencies can have security vulnerabilities that could affect your project if left unpatched.
- It aids in aligning with licensing requirements. Each dependency may have its own license, and you need to ensure you comply with all of them.
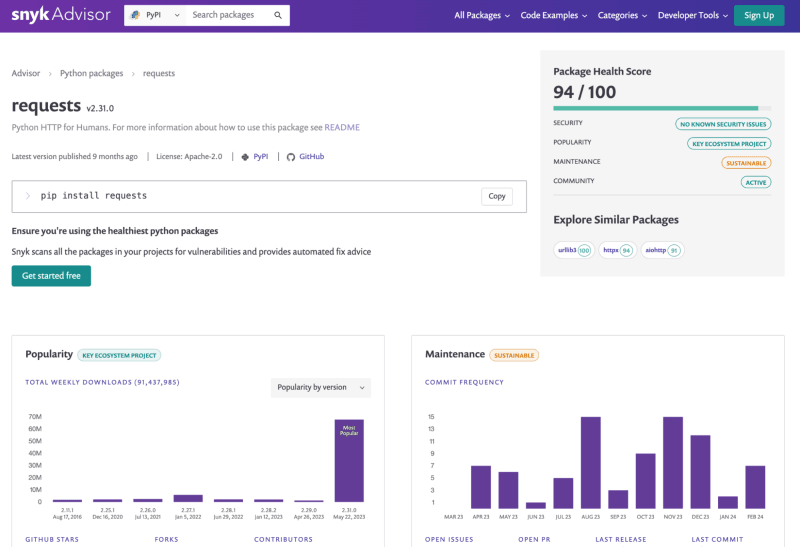
Snyk Advisor for dependency analysis
Snyk Advisor is a tool that provides insights into your Python project's dependencies, including information about security vulnerabilities, licensing issues, and outdated packages. It helps you understand the risks associated with your dependencies and provides actionable advice on how to mitigate them.
The Snyk CLI can be used to analyze your Python project's dependencies and alert you of vulnerable open source packages installed from PyPI or insecure code in your Python program. After installing the Snyk CLI, you can run the following command to analyze your project:
snyk test --all-projects
This command will analyze your project's dependencies and provide a report on any security vulnerabilities, licensing issues, or outdated packages. For example, it might alert you of vulnerabilities when you scan a Python FastAPI project:
Testing FastAPI...
✗ High severity vulnerability found in requests
  Description: Out-of-bounds Read
  Info: https://snyk.io/vuln/SNYK-PYTHON-REQUESTS-174006
  Introduced through: requests@2.25.1
  From: requests@2.25.1 > urllib3@1.26.3 > requests
  Fix: https://snyk.io/vuln/SNYK-PYTHON-REQUESTS-174006

Organization:      snyk
Package manager:   pip
Target file:       requirements.txt
Get started with Snyk for Python security to secure your first line of code and all the way to your last pip dependency and your deployed Python container applications.
Using pipenv graph for dependency analysis
Let's consider a simple Python Flask application to showcase dependency analysis in action. Here's the app.py file:
from flask import Flask
app = Flask(__name__)

@app.route('/')
def hello_world():
    return 'Hello, World!'
We will use Pipenv for this example. First, initialize Pipenv and install Flask:
pipenv install flask
Now, running pipenv graph will show:
flask==1.1.2
  - click [required: >=5.1, installed: 7.1.2]
  - itsdangerous [required: >=0.24, installed: 1.1.0]
  - Jinja2 [required: >=2.10.1, installed: 2.11.2]
    - MarkupSafe [required: >=0.23, installed: 1.1.1]
  - Werkzeug [required: >=0.15, installed: 1.0.1]
This output reveals that Flask, our project's direct dependency, depends on click, itsdangerous, Jinja2, and Werkzeug. Jinja2 further depends on MarkupSafe. Thus, we have successfully analyzed the dependencies of our project.
If you're new to pipenv and want to learn more about it, I recommend reading mastering Python virtual environments: A complete guide to venv, Docker, and securing your code to familiarize yourself with the concept of virtual environments in Python.
In conclusion, regular dependency analysis in Python projects is necessary to maintain code reliability, enhance security, and ensure licensing compliance. Tools like Snyk, Snyk Advisor, and Pipenv make this task more manageable and provide a clear picture of the dependency tree.
6. Code formatting tools
Adhering to a consistent code style and format is another aspect of maintaining code readability and efficiency. Code formatting tools play a vital role in this context. They help developers automatically format their codebase according to a set of predefined rules. This not only improves the code's overall quality but also reduces the time and effort required for manual code reviews. Let's introduce you to popular cde formatters like Black and YAPF.
Let's consider an example to understand the difference that a code formatter can make. Below is a piece of Python code before and after applying the Black formatter.
Before formatting:
def function(arg1,arg2,arg3=4,arg4=8,arg5=16):
    return arg1+arg2+arg3+arg4+arg5
print(function(1,2))
After formatting with Black:
def function(arg1, arg2, arg3=4, arg4=8, arg5=16):
    return arg1 + arg2 + arg3 + arg4 + arg5

print(function(1, 2))
YAPF Python code formatter
YAPF (Yet Another Python Formatter) is another code formatter for Python that goes beyond PEP8 to provide a more uniform code style. Unlike PEP8, YAPF takes into consideration how the code looks and makes it more readable.
Here is an example of how to use YAPF:
# install yapf
pip install yapf

# use yapf to format a python file
yapf -i your_python_file.py
7. Abstract syntax trees (AST) in Python
What is an abstract syntax tree (AST)? An abstract syntax tree is a tree representation of the syntactic structure of source code written in a programming language. Each node of the tree denotes a construct in the source code. The syntax is 'abstract' in not representing every detail appearing in the real syntax.
In Python, when the interpreter executes code, it first converts it into an intermediate form known as bytecode. This conversion process involves the creation of an AST. An AST in Python is a simplified representation of the Python code structure. It strips away details like formatting and whitespace, focusing only on the commands and their order, providing a structural view of the code.
The Python ast module and its capabilities
Python's standard library includes the ast module, which enables the creation, manipulation, and inspection of ASTs. This module provides a set of classes, functions, and helper methods to work with Python ASTs programmatically.
The ast.parse() function is a common entry point to create ASTs. It parses Python source code into an AST node, which can then be manipulated or inspected.
The ast module also provides a NodeVisitor class to walk the AST and call a visitor function for every node found. This class can be used as-is or subclassed to override methods and provide functionality for specific node types.
AST inspection and manipulation: A practical example
Let's dive into a simple example of using the ast module to inspect and manipulate an AST in Python.
import ast

# Parse some code into an AST
root = ast.parse("print('Hello, World!')")

# Print all the nodes in the AST
for node in ast.walk(root):
    print(type(node))

# Modify the AST to print a different message
for node in ast.walk(root):
    if isinstance(node, ast.Str):  # Change the string literal in the Print node
        node.s = 'Hello, AST!'

# Convert the modified AST back into code
code = compile(root, filename="", mode="exec")

# Execute the modified code
exec(code)
In this example, we first parse a simple Python print statement into an AST using ast.parse(). We then inspect the AST by walking through all the nodes and printing their types. After that, we modify the AST by changing the string literal in the Print node. Finally, we convert the modified AST back into code using compile() and execute it with exec(). The output of this code will be 'Hello, AST!', not 'Hello, World!'.
This example showcases the inspection and modification capabilities of the ast module in Python. The potential applications of ASTs in the field of code security and software development are vast, from automated code refactoring to advanced static code analysis for security vulnerabilities.
8. Control and data flow analysis
Control and data flow analysis are vital components. This technique facilitates efficient error detection, boosts code readability, and enhances the overall quality of Python applications.
Control flow analysis involves evaluating the execution order of statements or instructions in a program, while data flow analysis focuses on the tracking and analysis of data values as they change throughout the program. Here are some reasons why these analyses are important:
- Detection of potential errors: Control and data flow analysis can help identify potential bugs and vulnerabilities in the code, such as infinite loops, unreachable code, or unused variables.
- Code optimization: By understanding how data moves through your code and how control flows, you can identify areas of inefficiency and make necessary improvements.
- Enhanced code readability: Control and data flow analysis can help to make the code more understandable by highlighting the dependencies and interactions between different parts of the code.
- Security assurance: Understanding the flow of data and control in your application is essential for ensuring security. It can help identify potential security vulnerabilities, such as data leaks or injection attacks.
Code example demonstrating control and data flow analysis
To illustrate the concept of control and data flow analysis in Python, let's consider a simple Python function:
def calculate_total(price, quantity):
    if quantity <= 0:
        return "Invalid quantity"
    else:
        total = price * quantity
        return total
In this function, the control flow is determined by the if-else statement. If the quantity is less than or equal to 0, the function returns an error message. Otherwise, it calculates and returns the total price.
The data flow, on the other hand, can be traced from the input parameters (price and quantity) to the final result (total). The values of these variables change as they pass through the function.
A static analysis tool would analyze this function's control and data flow to detect any potential issues. For instance, it might flag an issue if price or quantity were used before being defined or if there was a possible path through the function where total wasn't defined before it was returned.
Through control and data flow analysis, you can develop efficient, understandable, and secure Python applications. By integrating this process into your software development life cycle, you can uphold code quality and prevent potential security vulnerabilities from creeping into your application.
9. Integration with Python development environments
Python static analysis tools are not meant to be standalone utilities. They are most effective when seamlessly integrated into the development environment, which can enhance development workflows, continuous integration (CI) pipelines, and code editors.
The following describes the roles of Python static analysis tools in these areas and provides a practical example of such integration:
- Role in development workflows: Static analysis tools play a pivotal role in development workflows. Python developers can use these tools to identify and fix potential issues during the development phase, even before the code is run. This early detection can save significant debugging time and enhance code quality.
- Role in CI pipelines: In Continuous Integration pipelines, static analysis tools can be used to automatically analyze the code in each commit or pull request. This ensures that any new changes adhere to the coding standards and do not introduce potential vulnerabilities. These tools can be integrated into CI pipelines such as Jenkins, GitLab CI, GitHub Actions, etc.
- Role in Code Editors: Most modern code editors, such as Visual Studio Code, PyCharm, Atom, and Sublime Text, support the integration of static analysis tools. This allows developers to get real-time feedback on their code structure, style, and potential vulnerabilities as they write the code.
Practical example: Integrating PyLint into Visual Studio Code
PyLint is a popular Python static analysis tool. Here's how you can integrate it into Visual Studio Code, a widely-used code editor.
Firstly, ensure you have PyLint installed in your Python environment. If not, you can install it using pip:
pip install pylint
Next, open Visual Studio Code and install the Python extension by Microsoft from the Extensions view.
After the extension is installed, open the settings (File > Preferences > Settings). In the User Settings section, search for Python Linting. Make sure the Enabled checkbox is checked and Pylint is selected in the Linter dropdown.
Now, every time you open a Python file in Visual Studio Code, PyLint will automatically analyze the code and highlight any issues it finds.
Here's a sample Python code and how PyLint would highlight an issue:
def add_numbers(a, b):
    return a + c
In the above code, PyLint would underline c and show a warning message Undefined variable 'c', helping you catch the error before running the code.
10. Performance profiling
Performance profiling is an essential dimension of Python static analysis. It involves examining your code to identify bottlenecks, inefficient sections, or parts of the code that consume significant CPU or memory resources. By conducting a thorough performance profiling, developers can optimize their code, enhancing the overall speed and efficiency of the application.
Performance profiling allows you to measure the complexity of your code in terms of time and space. Time complexity relates to the total time required to execute a program, while space complexity pertains to the amount of memory used by the program. A performance profile provides a detailed report of the function call count, the time spent in each function, and other information that can help optimize the application's performance.
Python code example demonstrating performance profiling
Python provides several tools for performance profiling, but one of the most common is the built-in cProfile module, which provides a robust and flexible profiler. Here's a simple example of how you can use it:
import cProfile
import re

def re_test():
    re.compile("foo|bar")

cProfile.run('re_test()')
When you run this code, cProfile will generate a report showing how much time was spent in each function. The output might look something like this:
   200 function calls (195 primitive calls) in 0.002 seconds

   Ordered by: standard name

   ncalls  tottime  percall  cumtime  percall filename:lineno(function)
        1    0.000    0.000    0.001    0.001 :0(setprofile)
       43    0.000    0.000    0.000    0.000 :0(time)
        5    0.000    0.000    0.000    0.000 :1(re\_test)
...
This output shows the number of calls to each function (ncalls), the total time spent in the function excluding calls to sub-functions (tottime), the cumulative time spent in the function including sub-functions (cumtime), and other useful information.
Performance profiling in relation to memory leaks and memory usage is also crucial for production applications. Drew Wright has written a great article on diagnosing and fixing memory leaks in Python from his own experience and struggles with memory leak issues faced during his time in the Snyk engineering team.
Performance profiling has a direct impact on your code. It helps you identify areas of your code that are performance bottlenecks, enabling you to focus on those areas for optimization. Profiling can also help find bugs that might not be visible during regular testing. Moreover, performance profiling can influence the way you write code. A proper understanding of time and space complexity can guide you to write more efficient code, ultimately leading to improved application performance.
结论
静态分析是一个强大的工具,可以显着提高代码质量并使其更加安全。通过利用我们在本文中讨论的 Python 静态分析的十个维度,您可以增强软件开发流程,防止潜在错误引入代码库,并确保您的应用程序不易受到安全威胁。
Python静态分析的各个维度共同作用,在潜在问题成为生产环境中的实际问题之前发现它们。通过尽早发现错误,您可以节省稍后修复这些错误的相关成本。 Python静态分析对于保证代码安全也至关重要。它可以发现在手动代码审查中很容易忽视的潜在安全漏洞。通过将 Python 静态分析合并到您的软件开发过程中,您可以使您的应用程序更加安全并保护它们免受潜在的攻击。
鼓励开发人员提供更好的代码和安全性我希望本文能让您更好地理解Python静态分析的十个维度以及如何利用它们来提高代码质量和安全性。请记住,高质量、安全的代码不仅仅在于防止错误或漏洞,还在于创建可靠、健壮且能够应对现实世界挑战的软件。
你知道如何防止Python中的命令注入吗?如何防止 Python 中的代码注入?
遵循 Python 安全最佳实践对于确保 Python 应用程序的安全至关重要。从今天开始,使用免费的 Snyk 帐户并安装 Snyk IDE 扩展,以快速轻松地查找和修复 Python 代码中的安全漏洞。
以上是Python靜態分析的維度的詳細內容。更多資訊請關注PHP中文網其他相關文章!