
Two questions to ask the master
1. Regarding the drop-down items for selecting json in ng-option, let the options in the select drop-down box be the cname of each group in grade.json. The "a.cname for a in gradejson" I wrote cannot make the drop-down box display cname in each column.
The select in html is as follows:
 <select ng-model="seleted"
             ng-options="a.cname for a in gradejson">
                <option value="">请选择科目</option>
             </select>
The corresponding controller is as follows:
 function($rootScope,$location,$scope,$http) {
         $http.get("grade.json")
         .success(function(data){
        $scope.gradejson=data;
        $scope.salesData=gradejson.salesData;
        $scope.seleted='';
        });
grade.json is as follows:
[
{
"cname": "总成绩",
"score": "490",
"salesData":[
{"scoredomain":80,"student_name": 80,"subject_scores": 16,"subject_scores2":14},
{"scoredomain":85,"student_name": 85,"subject_scores": 25,"subject_scores2":10}
]
},
{
"cname": "计算机网络",
"score": "90",
"salesData":[
{"scoredomain":90,"student_name": 90,"subject_scores": 24,"subject_scores2":7},
{"scoredomain":95,"student_name": 95,"subject_scores": 5,"subject_scores2":1}
]
}
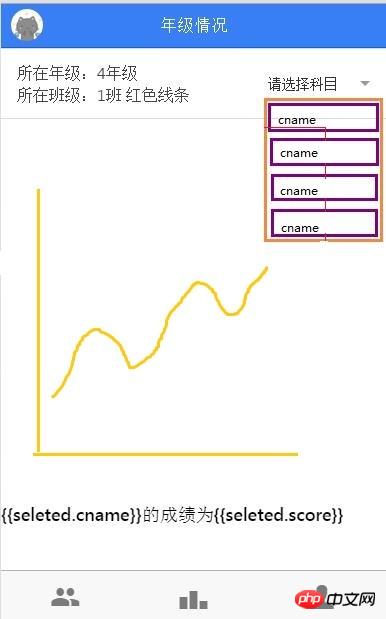
]The drop-down box in the picture below is currently unable to display the cname of each column. .
2. Masters, please look at the second question. It’s a bit difficult and has been bothering me for several days.
In the last picture, the picture drawn by the directive cannot be displayed (it should be a scope problem)
Every time a cname is selected, the data in the picture becomes the picture drawn by salesData in the same group of cname. The graphics instructions are drawn by the instructions in the directive. But I don’t know how to write the instruction scope. .
The following is in html:
<p linear-chart chart-data={{seleted.salesData}} ></p>
<h4>{{seleted.cname}}的成绩为{{seleted.score}}</h4>directive.js are as follows:
angular.module('myApp.directives',[])
         .directive('linearChart',function($window){
     return {
         restrict:'EA',
         template:"<svg width='350' height='350'></svg>",
         scope:{
      chartData:'=chartData'
    },
         link: function(scope, elem, attrs){
        scope.$watch('chartData',function(newData,oldData){
             if(!newData) return ;
             drawLineChart(newData);
          });
           var salesDataToPlot=scope[attrs.chartData];
           console.log(salesDataToPlot);
           var rawSvg=elem.find('svg');
           var svg = d3.select(rawSvg[0]);
           function setChartParameters(){
               xScale = d3.scale.linear()
                   .domain([salesDataToPlot[0].scoredomain,
                    salesDataToPlot[salesDataToPlot.length-1].scoredomain])
                   .range([padding + 5, rawSvg.attr("width") - padding]);
               yScale = d3.scale.linear()
                   .domain([0, d3.max(salesDataToPlot, function (d) {
                       return d.subject_scores;
                   })])
                   。。。
The error is reported as follows:

Please God give me strength! ! Can a master understand my description? If you don’t understand, please poke me hard.

PHPz2017-05-15 17:04:18
Regarding the first question, you can look here, it may be helpful to you.
给我你的怀抱2017-05-15 17:04:18
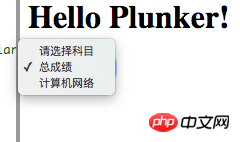
First question, there is nothing wrong with your code, the demo is here plunker

大家讲道理2017-05-15 17:04:18
html should be written like this:
<select ng-model="seleted" ng-options="a.cname for a in gradejson" >
<option value="">Please select a subject</option>
</select>
The controller should be written like this:
$scope.seleted='';
$http.get("grade.json")
.success(function(data){
$scope.gradejson=data ;});
.error(function(data){});