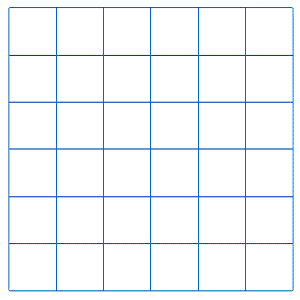
鼠标移到小方格内,小方格内颜色变为红色,离开恢复原色,用canvas怎么实现?
注:只能用canvas实现。
<!DOCTYPE html>
<html>
<body>

<canvas id="myCanvas" width="800" height="950" style="border:1px solid #d3d3d3;margin-top:10px">
Your browser does not support the HTML5 canvas tag.
</canvas>

<script>

var c=document.getElementById("myCanvas");
var ctx=c.getContext("2d");

let sAngle = 0;
let eAngle = Math.PI/90;
for(let j=0;j<5;j++){
  for(let i=0;i<180;i++){
  ctx.lineWidth = 0.2;
  ctx.beginPath();
  if(j==0){
    ctx.strokeStyle = "red";
  }else{
    ctx.strokeStyle = "gray";
  }
  if(j==4){
    ctx.fillStyle = "red";
    ctx.strokeStyle = "red";
    ctx.arc(100,100,50-j*8,0,2*Math.PI);
    ctx.fill();
    ctx.closePath()
    continue;
  }
  ctx.arc(100,100,80-j*15,sAngle,eAngle);
  ctx.stroke();
  ctx.closePath()
  sAngle = eAngle+Math.PI/90;
  eAngle = eAngle+2*Math.PI/90;
  }
}
for(let i=0;i<8;i++){
  ctx.beginPath();
  ctx.lineWidth = 0.5;
  ctx.moveTo(100-80*Math.cos(i*Math.PI/4),100-
  80*Math.sin(i*Math.PI/4));
  ctx.strokeStyle = "green";
 ctx.lineTo(100+80*Math.cos(i*Math.PI/4),100+80*Math.sin(i*Math.PI/4));
  ctx.stroke();
  ctx.closePath();
}
var domX = c.getBoundingClientRect().left+document.documentElement.scrollLeft;
var domY = c.getBoundingClientRect().left+document.documentElement.scrollLeft;


</script>

</body>
</html>
迷茫2017-04-11 11:43:07
用mousemouve事件,然后可以从event上获取当前鼠标位置。然后判断当前的xy在那个区域块中,给区域块改变颜色,同时将其他区域块改变成默认颜色
<!DOCTYPE HTML>
<html>
<body>

<canvas id="myCanvas">your browser does not support the canvas tag </canvas>

<script type="text/javascript">

var canvas=document.getElementById('myCanvas');
var ctx=canvas.getContext('2d');
ctx.fillStyle='#FF0000';
ctx.fillRect(0,0,80,100);
canvas.onmousemove=function(event){
 //console.log(event);
 var _pagex = event.pageX;
 var _pagey = event.pageY;
 var _pageLengthX = (_pagex / 40)|0;
 var _pageLengthY = (_pagey / 40)|0;
ctx.fillStyle='#FF0000';
ctx.fillRect(0,0,80,100);

ctx.fillStyle='#FFFFFF';
ctx.fillRect(
_pageLengthX*40,
_pageLengthY*40,
40,
40);
}
</script>

</body>
</html>
黄舟2017-04-11 11:43:07
需要事件你应该知道,然后就是event这个参数中,会有event.pageX和Y,根据你方格的区域判断距离的差值是否在你的这个方格内,然后绘图这个方块就可以了。记住画图钱save和restore比较好。
迷茫2017-04-11 11:43:07
<!DOCTYPE html>
<html>
<body>

<canvas id="canvas">
Your browser does not support the HTML5 canvas tag.
</canvas>

<script>

!function () {

  class Panel {
    constructor(canvas, x, y, r, n) {
      this.canvas = canvas;
      this.ctx = canvas.getContext('2d');
      this.ratio = 1;
      this.initScreenRatio();
      this.x = x * this.ratio;
      this.y = y * this.ratio;
      this.r = r * this.ratio;
      this.n = n * this.ratio;
      this.dr = Math.round(this.r / this.n);
      this.basePos = this.canvas.getBoundingClientRect();
      this.prePos = null;
      this.drawPanel();
      this.initEvent();
    }

    initScreenRatio() {
      const devicePixelRatio = window.devicePixelRatio || 1;
      const backingStoreRatio = this.ctx.webkitBackingStorePixelRatio ||
        this.ctx.mozBackingStorePixelRatio ||
        this.ctx.msBackingStorePixelRatio ||
        this.ctx.oBackingStorePixelRatio ||
        this.ctx.backingStorePixelRatio || 1;

      const ratio = devicePixelRatio / backingStoreRatio;
      this.canvas.style.borderWidth = 0;
      this.canvas.style.width = this.canvas.offsetWidth;
      this.canvas.style.height = this.canvas.offsetHeight;
      this.canvas.width = ratio * this.canvas.offsetWidth;
      this.canvas.height = ratio * this.canvas.offsetHeight;
      this.ratio = ratio;
    }


    drawPanel(clear) {
      const {x, y, ctx, r, dr, n,actived} = this;
      const _2PI = 2 * Math.PI;
      let i = 1;
      if(clear!==false){
        this.clear();
      }
      ctx.save();
      ctx.strokeStyle = '#ddd';
      ctx.setLineDash([8, 4]);

      //圆盘
      ctx.save();
      for (; i < n + 1; i++) {
        ctx.beginPath();
        ctx.arc(x, y, i * dr, 0, _2PI);
        if(i===n){
          ctx.strokeStyle = actived?'#f00':'#ddd';
        }
        ctx.stroke();
      }
      ctx.restore();
      //分割线
      ctx.translate(x, y);
      ctx.setLineDash([]);
      for (i = 0; i < 8; i++) {
        ctx.beginPath();
        ctx.moveTo(0, 0);
        ctx.lineTo(0, r);
        ctx.stroke();
        ctx.rotate(_2PI / 8);
      }
      ctx.restore();
    }

    clear(){
      this.ctx.clearRect(0,0,this.canvas.width,this.canvas.height);
    }

    getArea(px, py) {
      const {basePos, x, y, dr} = this;
      const dx = (px - basePos.left) * this.ratio - x;
      const dy = (py - basePos.top) * this.ratio - y;
      const d = Math.ceil(Math.sqrt(Math.pow(dx, 2) + Math.pow(dy, 2)));
      let anum = Math.ceil(d / dr);
      if (dx === 0) {
        anum = 0;
      }
      const actan = dx > 0 ? (dy > 0 ? Math.atan(dy / dx) : 2 * Math.PI + Math.atan(dy / dx)) : Math.PI + Math.atan(dy / dx);
      return {
        n: anum > this.n ? null : anum,
        rotate: Math.floor(actan * 4 / Math.PI)
      }
    }

    fillCellPath(pos, col) {
      const {ctx, dr, x, y} = this;
      if (pos.n) {
        this.clear();
        ctx.save();
        ctx.translate(x, y);
        ctx.rotate(pos.rotate * Math.PI / 4);
        ctx.beginPath();
        ctx.moveTo(0, 0);
        ctx.arc(0, 0, (pos.n) * dr, 0, Math.PI / 4);
        ctx.closePath();
        ctx.fillStyle = col || '#000';
        ctx.fill();
        ctx.beginPath();
        ctx.moveTo(0, 0);
        ctx.arc(0, 0, (pos.n - 1) * dr, 0, Math.PI / 4);
        ctx.closePath();
        ctx.fillStyle = '#fff';
        ctx.fill();
        ctx.restore();
        this.drawPanel(false);
      }
    }

    initEvent() {
      this.canvas.addEventListener('mousemove', (e) => {
        const pos = this.getArea(e.pageX, e.pageY);
        if (!this.prePos || this.prePos.n !== pos.n || this.prePos.rotate !== pos.rotate && pos.n) {
          this.actived = true;
          if (this.prePos) {
            this.fillCellPath(this.prePos, '#fff');
          }
          this.fillCellPath(pos, '#000');
          this.prePos = pos;
        }else if(!pos.n){
          this.actived = false;
          this.drawPanel();
        }
      })
    }

  }


  const canvas = document.getElementById('canvas');
  const panel = new Panel(canvas, 100, 100, 250, 5);

} ()


</script>

</body>
</html>
谁能解释下