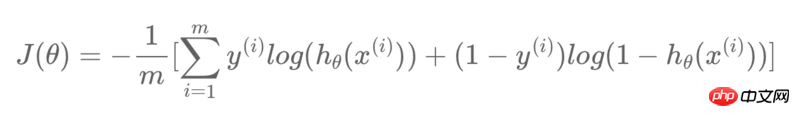
In TensorFlow, I want to create a logistic regression model with the following cost function:
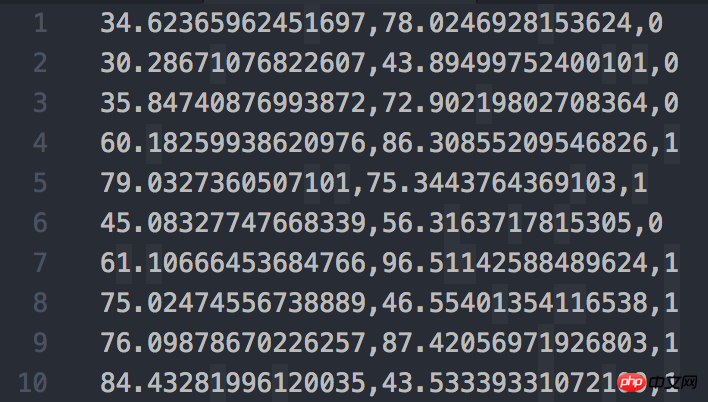
The screenshot of the data set used is as follows:
My code is as follows:
train_X = train_data[:, :-1]
train_y = train_data[:, -1:]
feature_num = len(train_X[0])
sample_num = len(train_X)
print("Size of train_X: {}x{}".format(sample_num, feature_num))
print("Size of train_y: {}x{}".format(len(train_y), len(train_y[0])))

X = tf.placeholder(tf.float32)
y = tf.placeholder(tf.float32)

W = tf.Variable(tf.zeros([feature_num, 1]))
b = tf.Variable([-.3])

db = tf.matmul(X, tf.reshape(W, [-1, 1])) + b
hyp = tf.sigmoid(db)

cost0 = y * tf.log(hyp)
cost1 = (1 - y) * tf.log(1 - hyp)
cost = (cost0 + cost1) / -sample_num

loss = tf.reduce_sum(cost)

optimizer = tf.train.GradientDescentOptimizer(0.1)
train = optimizer.minimize(loss)

init = tf.global_variables_initializer()
sess = tf.Session()
sess.run(init)

print(0, sess.run(W).flatten(), sess.run(b).flatten())
sess.run(train, {X: train_X, y: train_y})
print(1, sess.run(W).flatten(), sess.run(b).flatten())
sess.run(train, {X: train_X, y: train_y})
print(2, sess.run(W).flatten(), sess.run(b).flatten())
The screenshot of the running results is as follows:
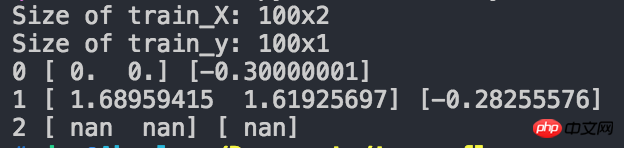
As you can see, after two iterations, the obtained W and b have become nan. What is the problem?

大家讲道理2017-06-28 09:25:45
After some searching, I found the problem.
In the sentence about selecting the iteration method:
optimizer = tf.train.GradientDescentOptimizer(0.1)The learning rate of 0.1 here is too large, which leads to the situation log(0) appearing in the loss function for unknown reasons. As a result, the value of the loss function is nan. The solution is to reduce the learning rate. For example, if you lower it to 1e-5 or 1e-6, you can train normally. I adjusted the learning rate to 1e-3 according to my own situation, and the program runs perfectly.
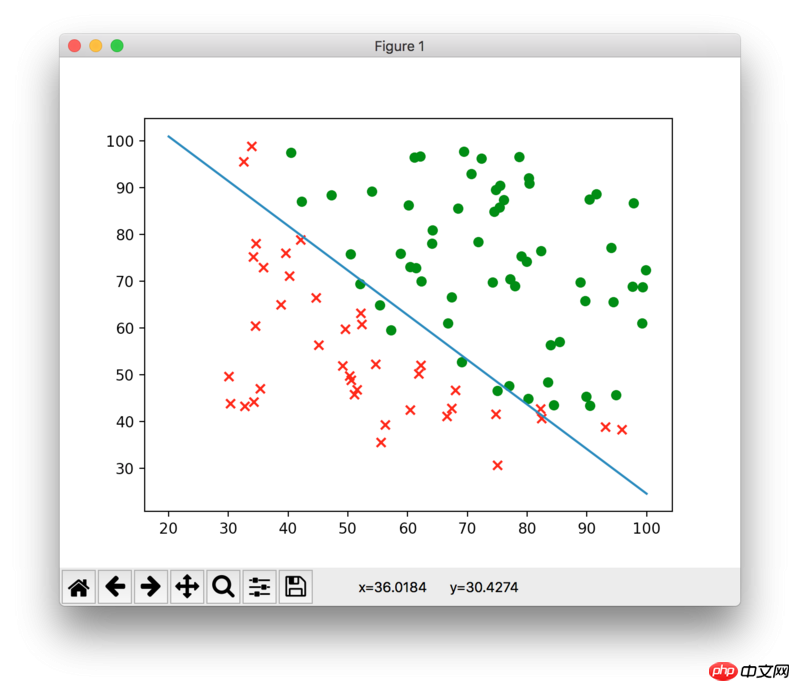
Attached is the final fitting result: