Let me go directly to the demo address so that I can easily check the problem. The code is also written on the page.
By default, the request is made once, and then the timer is used to request data and update the chart every once in a while, but I found that I requested After success,
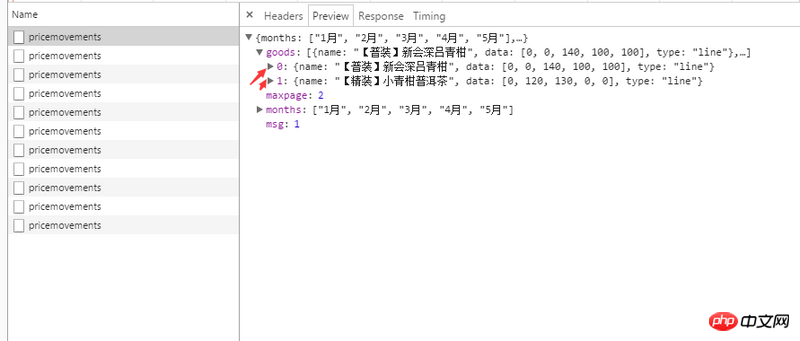
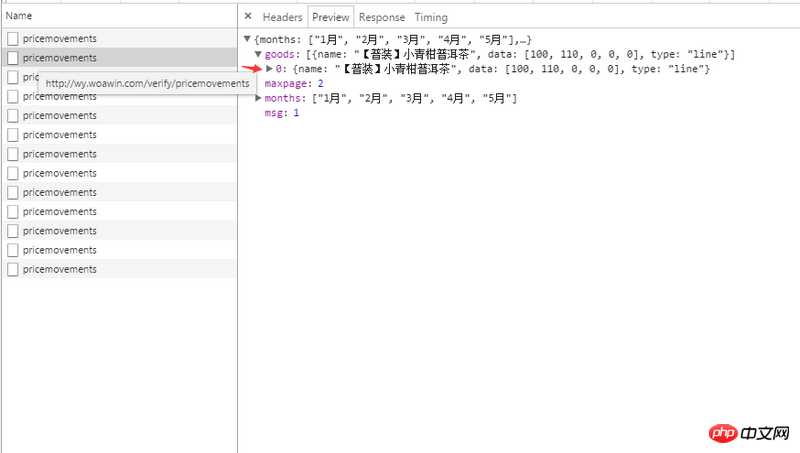
When you want to retry Tcharts.setOption(option), the last data still exists. For example, my first request is for 2 pieces of data, and then there is no problem with rendering. The second request returns 1 piece of data. Sometimes, there is a rendering problem, and the chart still contains the last data
I took a screenshot of the picture requested by ajax

    var maxpage = 1;
    var dataPage = 1;
    var option = {};
    var dataArray ,xAxisArray,legendArray;
    var Tcharts = echarts.init(document.getElementById('Tcharts'));
    Tcharts.setOption({
        title: {
            //是否显示标题组件
            show : false
        },
        tooltip: {
            trigger: 'axis'
        },
        legend: {
            data:[],
            left : 'auto',
            right : '0',
            top : '0',
            bottom : 'auto',
            padding : 5,
            itemWidth : 10,
            itemGap : 20
        },
        grid: {
            show : true,
            left: '0',
            right: '3%',
            bottom: '0',
            top: '15%',
            containLabel: true,
            borderColor : '#ffffff'
        },
        toolbox: {
            show : false,
            feature: {
                saveAsImage: {}
            }
        },
        xAxis: {
            show : true,
            type: 'category',
            data: [],
            nameGap : 10,
            boundaryGap : false,
            nameTextStyle : {
                color : '#f2f2f2'
            },
            axisLabel : {

            },
            axisLine : {
                show : false,
                onZero : true,
                lineStyle : {
                    color : '#999999',
                    fontWeight : 'bold'
                }
            },
            splitLine : {
                show : false
            },
            axisTick : {
                lineStyle : {
                    color : '#ff5a2a',
                    width : 1
                },
                show : false //是否显示坐标轴刻度
            }
        },
        yAxis: {
            type: 'value',
            axisLine : {
                show : true,
                onZero : true,
                lineStyle : {
                    color : '#999999',
                    fontWeight : 'bold'
                }
            },
            axisLabel : {
            },
            axisTick : {
                show : false //是否显示坐标轴刻度
            }
        },
        series: [],
        textStyle : {
            fontFamily : 'Helvetica Neue,Helvetica,PingFang SC,Hiragino Sans GB,Microsoft YaHei,Arial,sans-serif'
        },
        color : ['#ff5a2a','#a981f3','#1496ec','#55ea84'] //线条颜色列表
    });
    Tcharts.showLoading({
        text: "图表数据正在努力加载..."
    });
    //withDate
    function withDate(data){
        dataArray = [];
        xAxisArray = [];
        legendArray = [];
        var goods = data.goods,months = data.months;
        if (data.msg === 1) {
            for (var g = 0;g < goods.length;g++) {
                dataArray.push(goods[g]);
                legendArray.push({icon : 'circle',name : goods[g].name});
            }
            for (var m = 0;m < months.length;m++) {
                xAxisArray.push(months[m]);
            }
            option = {
                legend: {
                    data : legendArray
                },
                xAxis : {
                    data : xAxisArray
                },
                series : dataArray
            }
            //console.log(dataArray +":" + xAxisArray + ":" + legendArray);
            Tcharts.setOption(option);
        }else {

        }
    }

    //ajax
    function getDate(){
        $.ajax({
            type: "post",
            url: "http://wy.woawin.com/verify/pricemovements",
            data : {dataPage : dataPage},
            dataType : "json",
            async : true,
            success : function(data){
                Tcharts.hideLoading();
                withDate(data);
                dataPage ++;
                maxpage = data.maxpage;
            }
        });
    }

    getDate();

    window.setInterval(function(){
        if( maxpage >= dataPage){
            getDate();
        }else{
            dataPage = 1;
            getDate();
        }
    },10000);
Online demonstration underground demonstration effect
我想大声告诉你2017-06-26 10:58:56
echarts' setOption said that if the new data does not overwrite the original data, the original data will continue to be reused.
Your series.data used to be in the form of [{},{}]. When you re-setOption, it should be like this [{}], and the other object will continue to be reused.
Personal speculation, please correct me if I’m wrong
let dataArr = [];
promise.then(result) {
    dataArr.fill({});
    result.data.forEach((item, index) => dataArr[index] = item);
    // 使用dataArr 进行渲染
}