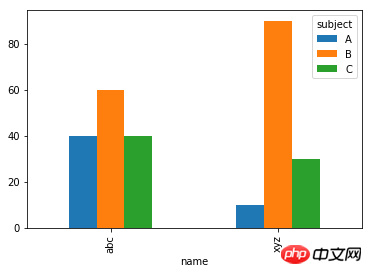
How to draw a bar chart with the name as the abscissa and the score as the ordinate? 
仅有的幸福2017-06-20 10:07:45
Try it
df.pivot('name', 'subject', 'score').plot.bar()
The basic pandas visualization principle is to use pivot or melt to create the table format required for charting.
The following is the code I ran (Jupyter Notebook)
% matplotlib inline
data = [ {"name":"abc", "subject":"A", "score":40}, {"name":"abc", "subject":"B", "score":60}, {"name":"abc", "subject":"C", "score":40},
        {"name":"xyz", "subject":"A", "score":10}, {"name":"xyz", "subject":"B", "score":90}, {"name":"xyz", "subject":"C", "score":30}]
df = pd.DataFrame(data)
df.pivot('name', 'subject', 'score').plot.bar()
Result: 