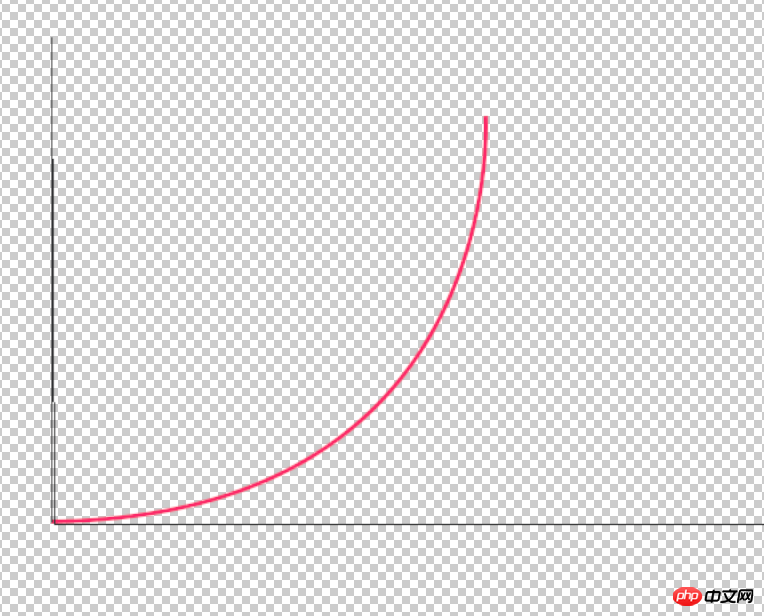
It’s not about drawing this line, it’s a function, the parameter is an x, and the return value increases with the value of x, showing the trend in the picture above. Please provide such a function, thank you!
習慣沉默2017-06-14 10:54:30
Upper Parabola? It looks like a quarter circle from the picture. .
For example, quadratic function
y = ax^2 + bx + c
// 柯里化
var y = a => b => c => x =>  a * x ** 2 + b * x + c;

// y = x^2
var ept = y(1)(0)(0);
About this
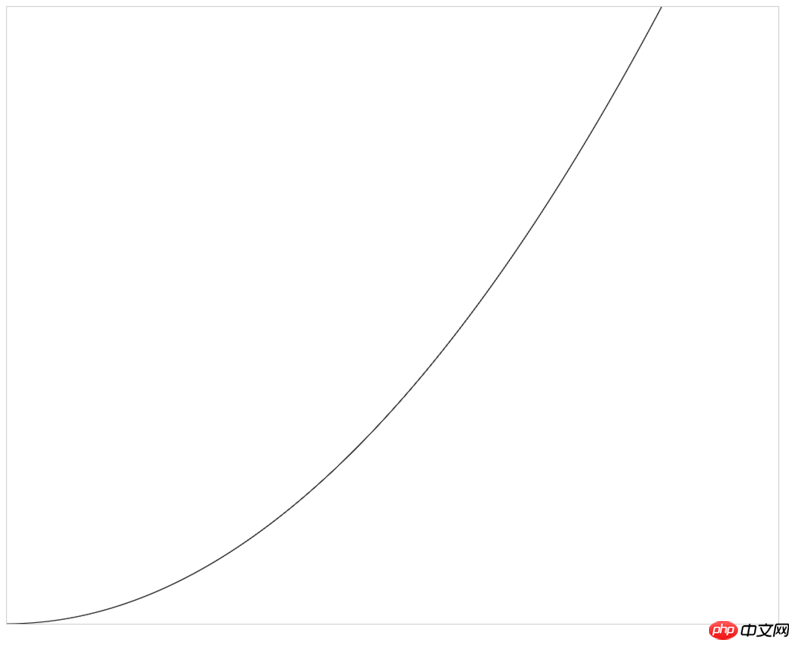
Have a look and this one is more consistent. . .
y = -cos wx + o
// 柯里化
var y = A => W => O => OFFSET =>  x => A * Math.cos(W * x + O) + OFFSET;

// cosineLine(x) = -1000cos(w)
var cosineLine = y(-1000)(1)(0)(500);
Probably like this. . . .
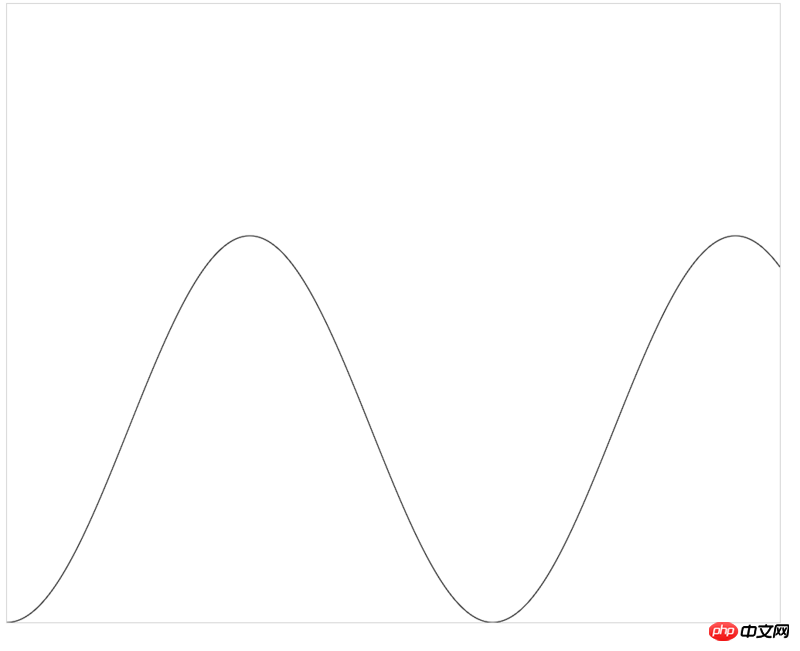
The mathematical form is
x^2 = 2p * y
that is
y = x ^ 2 / 2p
Same as the exponential function form
// 柯里化
var y = p => x => x * x / 2p; 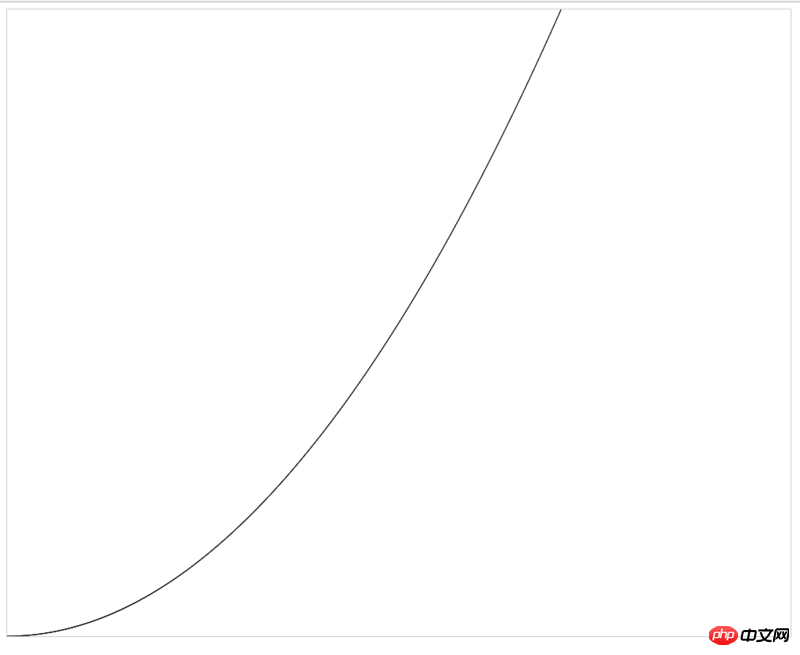
// y = a^x - 1
// 柯里化
var y = a => x => a ** x - 1;
Probably looks like this
Use...canvas' arc to draw an arc
Probably looks like this
g.arc(0,0,800, 0, 2*Math.PI);
g.stroke();
However, when x reaches outside the radius, there is no real solution. .
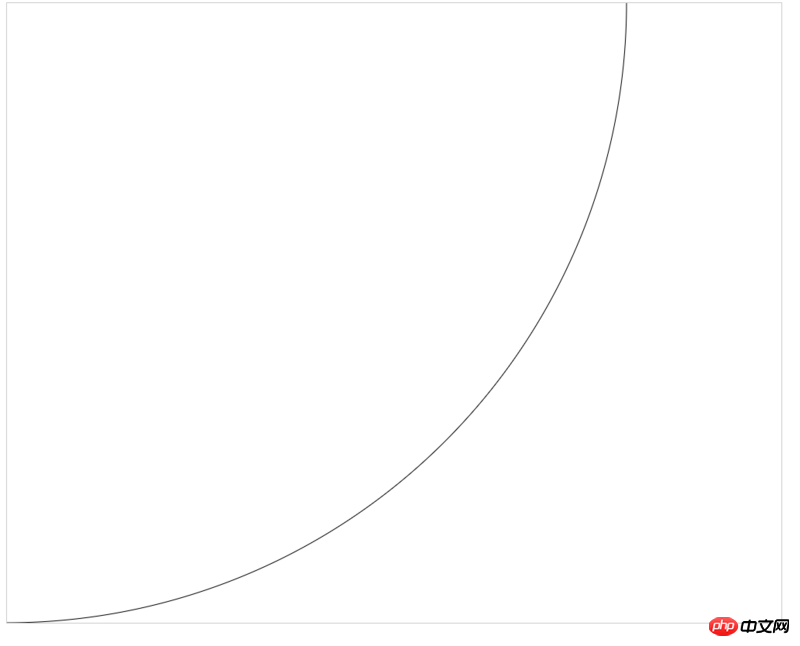
Probably like this. . But it is easy to stack overflow. .
function render(g, line, x = 0){
    var y = line(x / 50);

    if (y <= 800) {
        g.lineTo(x, 800 - y);
        render(g, line, x + 0.5);
    } else {
        g.stroke();
    }
}