
import turtle


def main():
    #设置窗口信息
    turtle.title('数据驱动的动态路径绘制')
    turtle.setup(800, 600, 0, 0) # 坐标原点在中心

    #设置画笔
    pen = turtle.Turtle()
    pen.color('red')
    pen.width(4)
    pen.shape('turtle')
    pen.speed(5)

    #读取文件
    result = [] #定义一个空列表
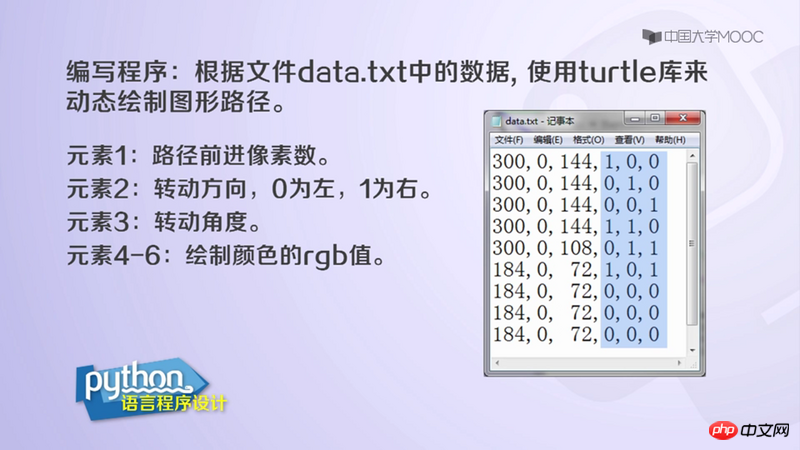
    file = open('data.txt', 'r')
    for line in file:
        result.append(list(map(float, line.split(','))))   # map()将其他类型的数转换成list
        # list(map(float, line.split(','))) 将float作用于line.split(',')每一项,并生成一个list
        print(result)

    # 动态绘制
    # 300(forward 300px), 0(0:left; 1:right), 144(angle), 1, 0, 0 (rgb)
    for i in range(len(result)):
        pen.color(result[i][3], result[i][4], result[i][5])
        pen.forward(result[i][0])
        if result[i][1]:
            pen.rt(result[i][2]) # rt : right
        else:
            pen.lt(result[i][2]) # lt : left
    pen.goto(0, 0) #将画笔定位于窗口的原点

if __name__ == '__main__':
    main()
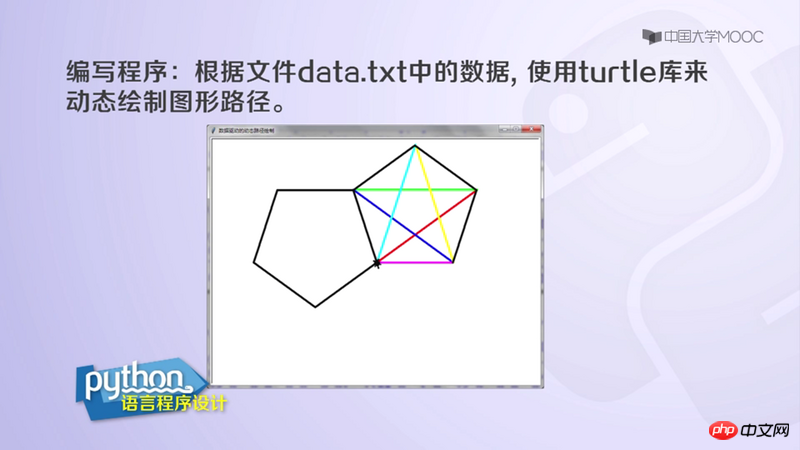
Shouldn’t the value of len(result) be 9? Why does the drawn picture have several more strokes than the loop?
淡淡烟草味2017-06-12 09:29:44
Because the data.txt on the right side of the first PPT you see is incomplete, and there are still a few lines that are not displayed. You have to drag the scroll bar down to see it all