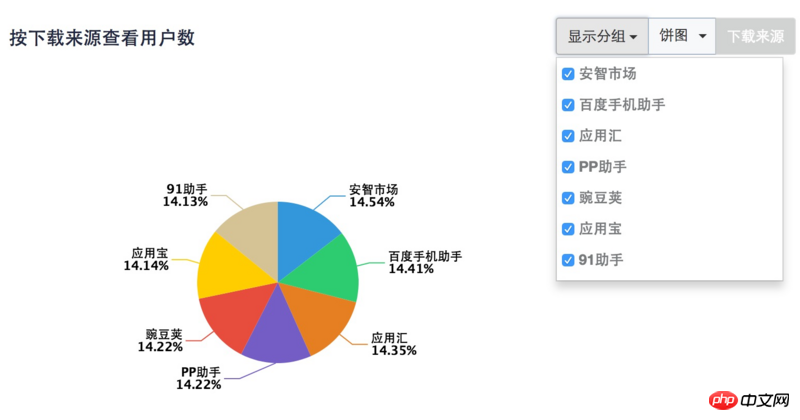
The picture shown is an echarts pie chart. The drop-down list on the right can control the display and hiding of the corresponding sector area. It is the same as the function of clicking the echarts legend to control the display and hiding. How to implement it?
世界只因有你2017-06-12 09:25:59
I have never used it, and I don’t know the environment of this project, but I can give you some ideas and make a fool of myself
When you click on the drop-down list, bind an event to the check box, and write the API exchanged by yourself. For example, click on the application sink, and then trigger the event. The application sink in the pie chart triggers the click event. If you are jq Just use trigger. Other frameworks have their own methods. The ideas are similar

ringa_lee2017-06-12 09:25:59
ECharts does not seem to directly provide the function you want. In fact, you can store the requested data in a variable, write the corresponding data processing method to filter the data, and re-setOption the processed data.
女神的闺蜜爱上我2017-06-12 09:25:59
Thank you for your answers! By consulting the official documentation, this problem has been solved. Just call the myChart.dispatchAction method!