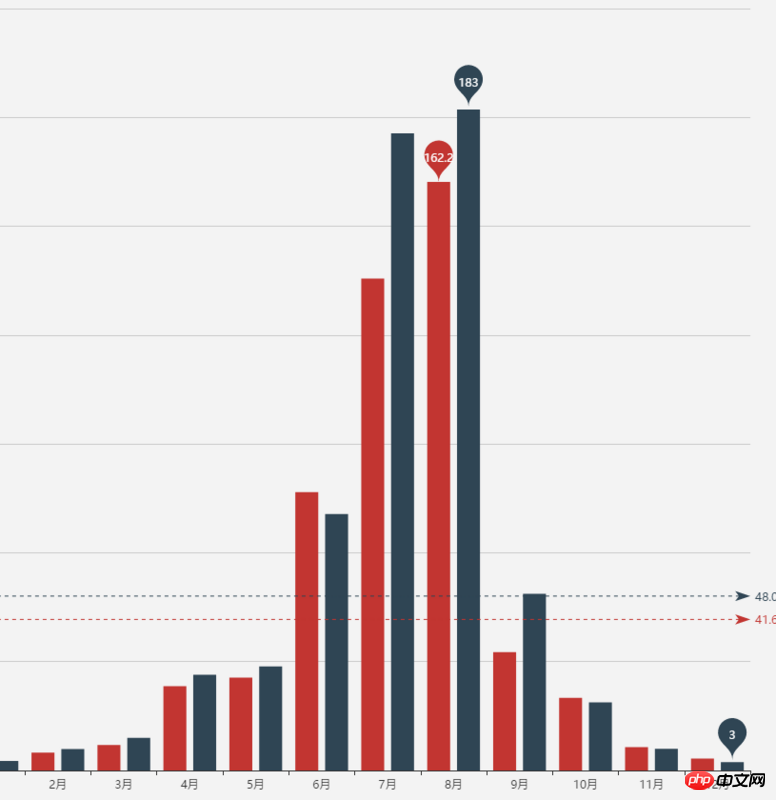
Currently I know it should be set here
series[
    {
        markpoint:{
            data:[]
        }
    }
]
But it is not clear what value should be filled in the data.
The official example is like this
data : [
    {type : 'max', name: '最大值'},
    {type : 'min', name: '最小值'}
]
Bubbles are only used on the maximum and minimum. The effect I want is to display it on each column, and the displayed value is the value corresponding to the y-axis. How should it be set?
Official example picture: 