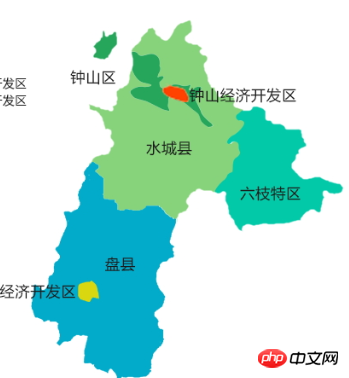
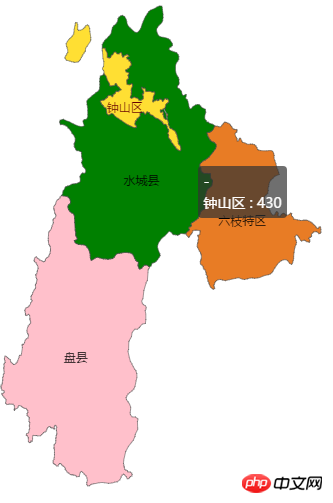
 A picture needs this
 To do this now, we need to add two new areas in Panxian and Zhongshan District, as shown in the picture
淡淡烟草味2017-05-19 10:33:54
The map format used by echarts is geojson, and the address is geojson.io.
If the echarts map you download is an uncompressed version, the code inside will be the same as geojson. You can first trace the points on geojson.io, and then put them into the map you downloaded, and the effect will be produced. Of course, there are still some minor problems. If it is a compressed version, you will be confused when you open it. It is all @AABB and the like. Unlike the uncompressed version, it is all coordinates and is difficult to modify.
I recommend downloading the uncompressed version first, modifying it, then compressing the modified parts and putting them into the compressed version. This will give you the best effect. It seems that the compression method can be found online. In fact, it is a transcoding file of echarts. You can use it after modifying it.
我想大声告诉你2017-05-19 10:33:54
Can be achieved through bubbles in echart. Click to jump to related documents.
You can change the default bubble type (you can use pictures) through the bubble's symbol attribute. Just make two bubbles and use the pictures of the two newly added areas.