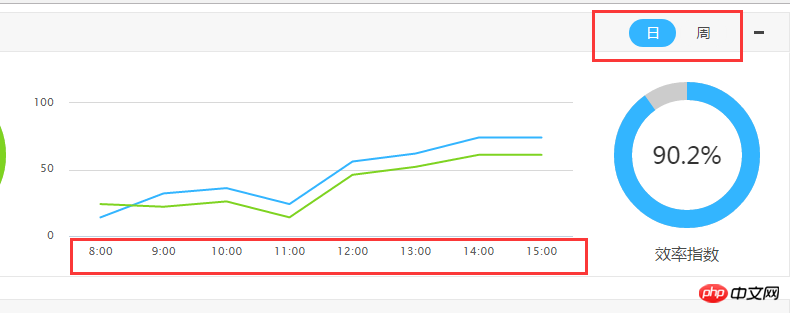
Default day, the x-axis shows hours, switch to month, the x-axis shows 04/28
phpcn_u15822017-05-19 10:30:16
The data in the daily dimension should be different from the data in the monthly dimension, right?
For example, when it is calculated by day, it is one point every hour, and when it is calculated by month, it is one point every day.
If this is the case, trigger Highcharts.chart(idSelector, options) when clicking the switch button and redraw it using another configuration.