
I want to display the data obtained from the API as a real-time trend chart, as shown below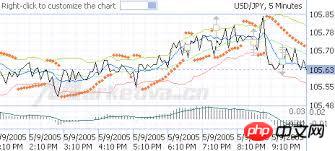
I have only used matplotlib.pyplot to make graphs. matplotlib.pyplot seems to be static. Is there any dynamic or real-time version? Thanks

PHP中文网2017-05-18 10:55:19
matplotlib can draw dynamically updated graphs. The principle is to obtain corresponding data from the API regularly and continuously draw graphs
Related codes can be searched: matplotlib dynamic update
