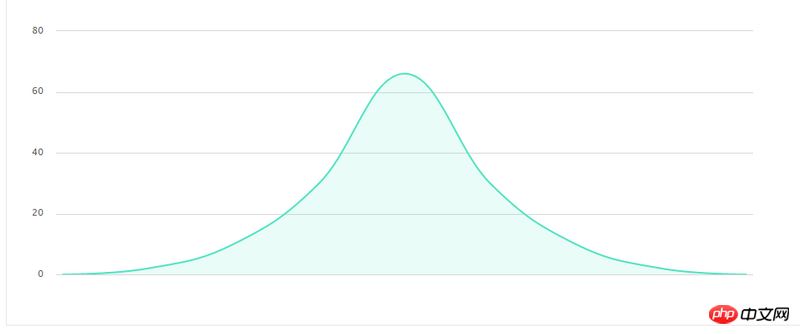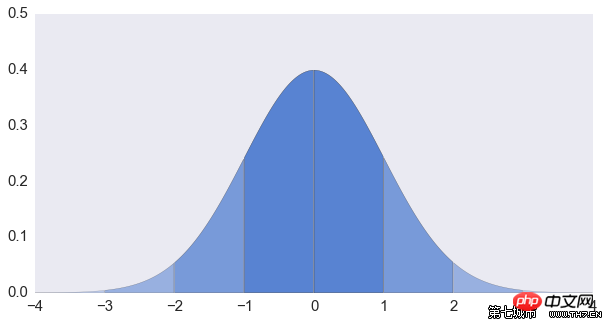

How to make the graphics in the area chart of the first highchart display in different ranges and in different colors. Similar to the second picture.
阿神2017-05-18 10:54:08
This can be achieved using the partition function.
Reference example: https://code.hcharts.cn/demos...
API document address: https://api.hcharts.cn/#plotO...