


Introduction
1 Background
PHP's xhprof extension Facebook will no longer be updated and maintained because Facebook has fully used HHVM and no longer uses the PHP zend engine.
xhprof does not support the new version of PHP (PHP7). The tideways extension is maintained from the xhprof project fork and currently supports PHP 7.2, 7.1, 7.0, 5.6 and 5.5.
tideways is an open source project. It only charges for UI services. In fact, xhgui can fully meet our daily needs
# #2 Function
Tideways is an extension used to test PHP performance. It can obtain the functions called during the entire process of PHP execution, the number of function calls, execution time, CPU time, and memory usage. , memory peak, total execution time, total CPU time, total memory usage, total memory peak and other data, analyze the above data to find out the performance bottleneck of PHP, analyze the PHP execution process, etc.3 Advantages
- tideways is a PHP extension, combined with xhgui, there is no need to bury it in the PHP code Monitoring code
- You can set the execution frequency (for example, 1/100) without generating execution logs for every request, resulting in performance loss; you can also actively control whether to generate execution logs by requesting Parameters to control (debug=1)
- There is a simple and direct UI to transform data
- You can freely match the conditions for data filtering. For example, analyze a specific interface, analyze the interface request situation in a certain time period, etc.
4 Disadvantages
Although non-intrusive, if execution logs are generated for each interface, the consumption of CPU and memory is not negligible.5 Implementation principle
- tideways extension is responsible for generating running logs
- In nginx, by configuring fastcgi_param PHP_VALUE auto_prepend_file, Execute the PHP file configured with auto_prepend_file before the request starts. The register_shutdown_function method is used in the file. At the end of the PHP process, tideways_disable is called to realize the embedding of tideways. Then the execution log is stored in mongodb or mysql or a file, and displayed after analysis by xhgui. , display formats include bar chart, waterfall flow, and flame chart.
Application
Next, we will introduce two application methods:IntrusiveandNon-invasive
The intrusive type refers to adding code to the code, and the intrusive type uses the default UI; The non-intrusive type refers to adding code without making any changes to the code. Modify nginx/apache to implement code injection, using xhgui non-invasively; Installationtideways_xhprof
git clone "https://github.com/tideways/php-xhprof-extension.git"
cd php-xhprof-extension
phpize
./configure --with-php-config=/usr/local/php7/bin/php-config
make
sudo make install
Add extension=tideways_xhprof.so# in php.ini
##Non-intrusive:<?php tideways_xhprof_enable();
// your application code
$data = tideways_xhprof_disable();
file_put_contents(
sys_get_temp_dir() . "/" . uniqid() . ".yourapp.xhprof",
serialize($data)
);
// $data = tideways_xhprof_disable();
// file_put_contents(
// sys_get_temp_dir() . "/" . date('His', time()) . ".material.xhprof",
// serialize($data)
// );The .xhprof file generated here is in the tmp directory. The default UI will also search for .xhprof in the tmp directory. File
Installs the default UI used to find datagit clone git@github.com:phacility/xhprof.git
and in this repository xhprof_html directory into your web folder and navigate to xhprof_html/index.php to see the trace list. If you want to see function call notes, you need to install Callgraph
Install CallgraphCallgraph is actually a combination of three tools become.
One is cflow or calltree which is used to generate C function call tree. The following mainly introduces cflow.
A tool for processing dot text graphics language, enhanced by graphviz.
A script for converting C function call tree to dot format: tree2dotx
Take Ubuntu as an example, install them separately:
sudo apt-get install cflow graphviz
Next install tree2dotx and Callgraph , here they are installed to /usr/local/bin by default.
wget -c https://github.com/tinyclub/linux-0.11-lab/raw/master/tools/tree2dotx
wget -c https://github.com/tinyclub/linux-0.11-lab/raw/master/tools/callgraph
sudo cp tree2dotx callgraph /usr/local/bin
sudo chmod +x /usr/local/bin/{tree2dotx,callgraph}
The next two renderings are shown:


Intrusive: Intrusive use of xhgui requires mongodb
Install xhguigit clone git@github.com:perftools/xhgui.git
Configure Nginxserver {
listen 80;
server_name site.localhost;
root /Users/markstory/Sites/awesome-thing/app/webroot/;
fastcgi_param PHP_VALUE "auto_prepend_file=/home/www/xhgui/external/header.php"; #这里依据个人目录而配
}What this means is to execute header.php before executing the project php code, so as to achieve the purpose of non-intrusive detection performance
xhgui configuration (Frequency of generating logs)In xhgui’s config/config.default.php, the number of sampling hits can be set;
return rand(1, 100) === 42; 为1%的采样率,改成return True;则标识每次都采样
'profiler.enable' => function() {
   // url 中包含debug=1则百分百捕获
   if(!empty($_GET['debug'])){
       return True;
   }else{
       // 1%采样
       return rand(1, 100) === 42;
   }
}
mongodb的配置
xhgui/config/config.default.php
// Can be either mongodb or file.
   /*
   'save.handler' => 'file',
   'save.handler.filename' => dirname(__DIR__) . '/cache/' . 'xhgui.data.' . microtime(true) . '_' . substr(md5($url), 0, 6),
   */
   'save.handler' => 'mongodb',
   // Needed for file save handler. Beware of file locking. You can adujst this file path
   // to reduce locking problems (eg uniqid, time ...)
   //'save.handler.filename' => __DIR__.'/../data/xhgui_'.date('Ymd').'.dat',
   'db.host' => 'mongodb://127.0.0.1:27017',
   'db.db' => 'xhprof',
mongo服务器的配置
mongo
 > use xhprof
 > db.results.ensureIndex( { 'meta.SERVER.REQUEST_TIME' : -1 } )
 > db.results.ensureIndex( { 'profile.main().wt' : -1 } )
 > db.results.ensureIndex( { 'profile.main().mu' : -1 } )
 > db.results.ensureIndex( { 'profile.main().cpu' : -1 } )
 > db.results.ensureIndex( { 'meta.url' : 1 } )
最后展示几张xhgui的效果图


相关学习推荐:PHP编程从入门到精通
The above is the detailed content of How to use xhprof to test php performance in php7? (Method introduction). For more information, please follow other related articles on the PHP Chinese website!

 php7检测tcp端口不好用怎么解决Mar 22, 2023 am 09:30 AM
在php5中,我们可以使用fsockopen()函数来检测TCP端口。这个函数可以用来打开一个网络连接和进行一些网络通信。但是在php7中,fsockopen()函数可能会遇到一些问题,例如无法打开端口、无法连接到服务器等。为了解决这个问题,我们可以使用socket_create()函数和socket_connect()函数来检测TCP端口。
 php7.0怎么安装mongo扩展Nov 21, 2022 am 10:25 AM
php7.0安装mongo扩展的方法:1、创建mongodb用户组和用户;2、下载mongodb源码包,并将源码包放到“/usr/local/src/”目录下;3、进入“src/”目录;4、解压源码包;5、创建mongodb文件目录;6、将文件复制到“mongodb/”目录;7、创建mongodb配置文件并修改配置即可。
 php7.0安装了插件还是显示未安装怎么办Apr 02, 2024 pm 07:39 PM
解决 PHP 7.0 中插件未显示已安装问题的方法:检查插件配置并启用插件。重新启动 PHP 以应用配置更改。检查插件文件权限,确保其正确。安装丢失的依赖项,以确保插件正常运行。如果其他步骤均失败,则重建 PHP。其他可能原因包括插件版本不兼容、加载错误版本或 PHP 配置问题。
 php8和php7哪个好Nov 16, 2023 pm 03:09 PM
PHP8相较于PHP7在性能、新特性和语法改进、类型系统、错误处理和扩展等方面都有一些优势和改进。然而,选择使用哪个版本要根据具体的需求和项目情况来决定。详细介绍:1、性能提升,PHP8引入了Just-in-Time(JIT)编译器,可以提高代码的执行速度;2、新特性和语法改进,PHP8支持命名参数和可选参数的声明,使得函数调用更加灵活;引入了匿名类、属性的类型声明等等。
 php7.0怎么安装部署Nov 30, 2022 am 09:56 AM
php7.0安装部署的方法:1、到PHP官网下载与本机系统对应的安装版本;2、将下载的zip文件解压到指定目录;3、打开命令行窗口,在“E:\php7”目录下运行“php -v”命令即可。
 PHP 服务器环境常见问题指南:快速解决常见难题Apr 09, 2024 pm 01:33 PM
PHP服务器环境常见的解决方法包括:确保已安装正确的PHP版本和已复制相关文件到模块目录。临时或永久禁用SELinux。检查并配置PHP.ini,确保已添加必要的扩展和进行正确设置。启动或重启PHP-FPM服务。检查DNS设置是否存在解析问题。
 php7怎么下载与安装(教程分享)Mar 23, 2023 pm 02:11 PM
随着互联网技术的发展,计算机编程语言也随之不断发展和更新。PHP作为一种广泛应用于Web开发领域的编程语言,在多年的发展中经历了多个版本的更新,而最新版的PHP7又在性能和稳定性上有了巨大提升。为了能更好地应用PHP编程语言,这篇文章将介绍PHP7的下载和安装教程,供初学者参考。
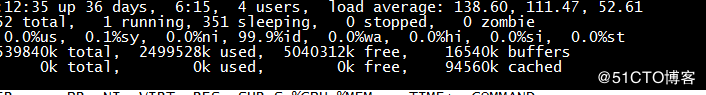 记录一次用strace诊断php占用系统资源过高的问题May 03, 2024 pm 04:31 PM
本地环境:redhat6.7系统。nginx1.12.1,php7.1.0,代码使用yii2框架问题:本地的web站需要用到elasticsearch服务。当php使用本地服务器搭建的elasticsearch时,本地的负载都是正常。当我使用aws的elasticsearchservice服务时,本地服务器出现负载经常过高的情况。查看nginx和php日志,发现没有异常。系统的并发连接数也不高。这时候想到我们老大给我讲的一个strace诊断工具。调试过程:查找一个php的子进程idstrace-


Hot AI Tools

Undresser.AI Undress
AI-powered app for creating realistic nude photos

AI Clothes Remover
Online AI tool for removing clothes from photos.

Undress AI Tool
Undress images for free

Clothoff.io
AI clothes remover

AI Hentai Generator
Generate AI Hentai for free.

Hot Article
Hot Tools

SublimeText3 Chinese version
Chinese version, very easy to use

mPDF
mPDF is a PHP library that can generate PDF files from UTF-8 encoded HTML. The original author, Ian Back, wrote mPDF to output PDF files "on the fly" from his website and handle different languages. It is slower than original scripts like HTML2FPDF and produces larger files when using Unicode fonts, but supports CSS styles etc. and has a lot of enhancements. Supports almost all languages, including RTL (Arabic and Hebrew) and CJK (Chinese, Japanese and Korean). Supports nested block-level elements (such as P, DIV),

SublimeText3 Linux new version
SublimeText3 Linux latest version

MantisBT
Mantis is an easy-to-deploy web-based defect tracking tool designed to aid in product defect tracking. It requires PHP, MySQL and a web server. Check out our demo and hosting services.

SAP NetWeaver Server Adapter for Eclipse
Integrate Eclipse with SAP NetWeaver application server.

