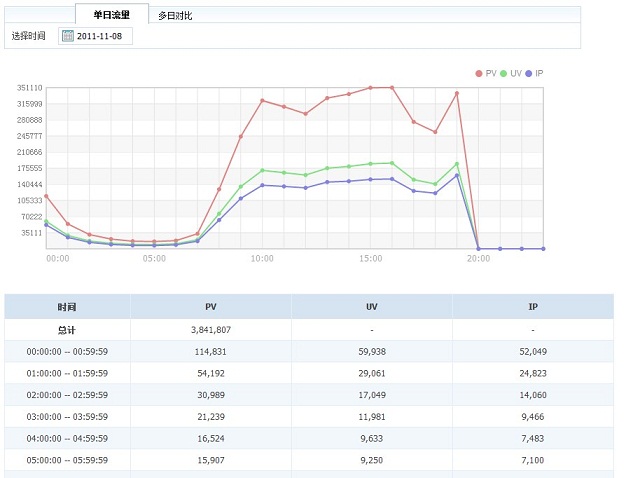
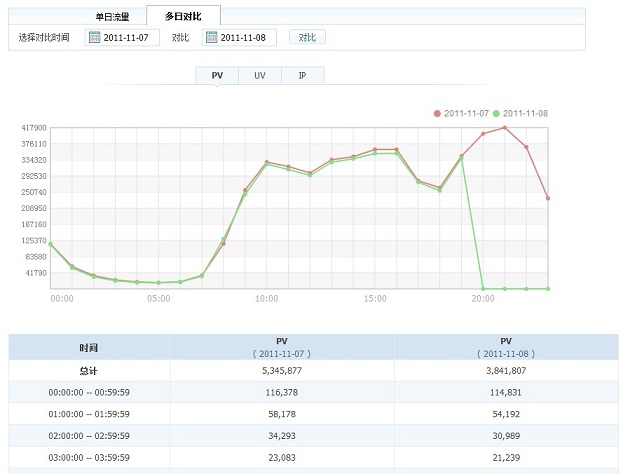
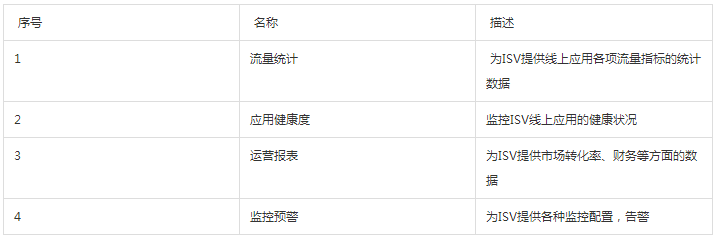
## Period analysis: According to the date selected by the inquirer, the PV, Analyze UV and IP data and changing trends. It is divided into two functions: single-day traffic and multi-day comparison.
Single-day traffic: Provides PV, UV, IP data and changes within each hour of a certain day.
Multi-day comparison: Provides comparison of changes in PV, UV, and IP traffic in hours for any two selected dates.
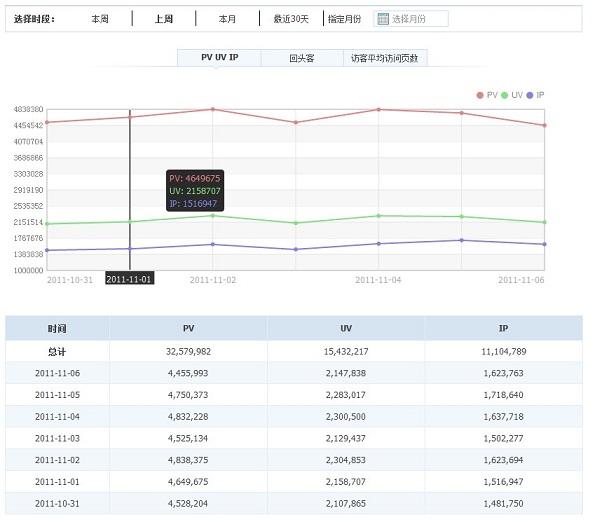
Including daily traffic trend charts and reports within the selected time period as well as repeat customers and average visitor pages Number
Daily analysis: Provides this week, last week, this month, and the last 30 On days and specified months, the traffic and user behavior of users accessing the application every day. Including: PV, UV, IP, repeat customers, average number of pages visited.
Repeat visitors: The same number of visitors as the previous day.
Average number of pages visited: daily PV / daily UV.
4) Analysis of visited pages
Includes the visited page traffic pie chart and the visited page traffic trend chart within the selected time period
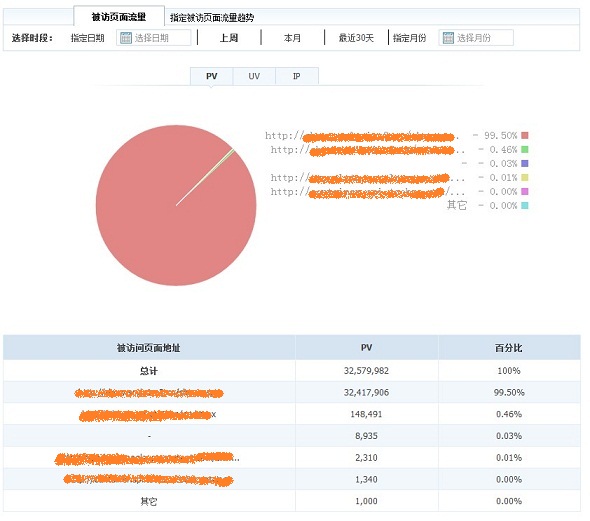
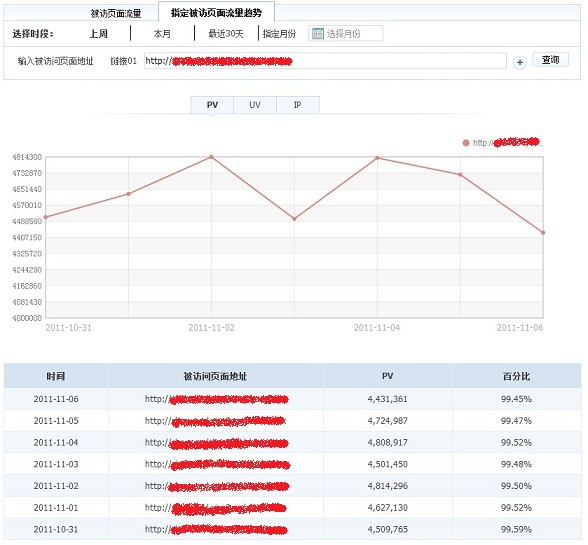
Analysis of visited pages: Provides the traffic and trends of visited pages of the application on the specified date, last week, this month, the last 30 days, and the specified month.
Including: visited page traffic, traffic trend of designated visited pages.
- ’ , the first five page information is currently displayed in the report, and the total amount of other pages is replaced by "Others".
# Specifying the traffic trend of the visiting page: You can provide the changing trend of the page by entering the address period of the interviewed page to the interviewed page to query, and you can query up to three at the same time.
5) Visited region analysis
#Includes the visited region traffic pie chart and the designated visited region traffic trend chart within the selected time period
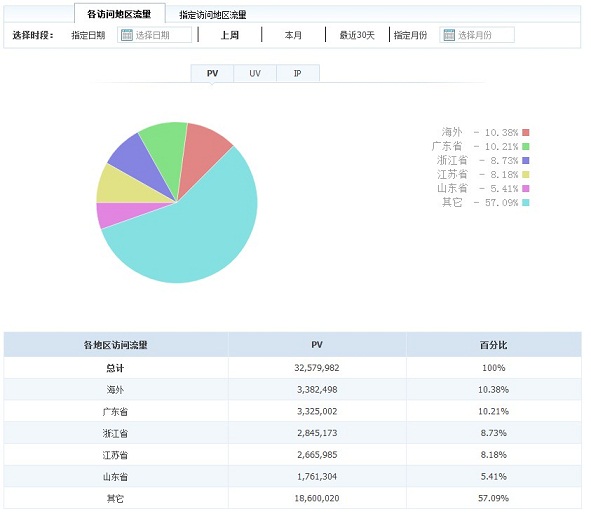
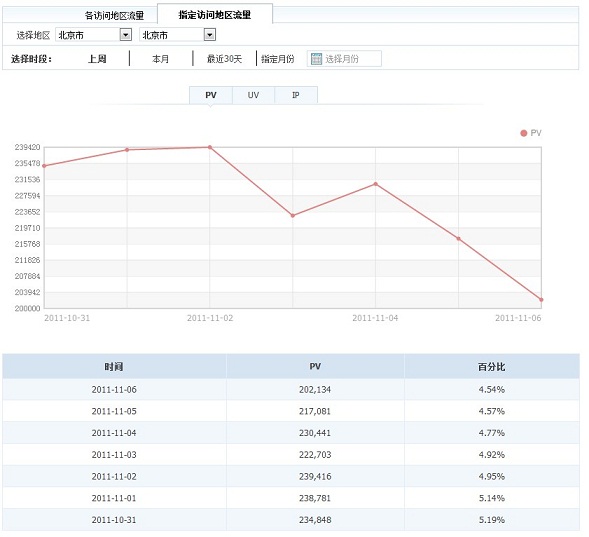
Visited area analysis: based on different sources Analyze and refine regional user behavior data, and deeply consider the quality and value of users in different regions. Data can be queried based on the specified date, last week, this month, the last 30 days, and the specified month. Including traffic in each visiting region and traffic trends in designated visiting regions.
’ s ’s ’s ’s ’ ’s ’ s ’s ’ s t ‐ ‐ ‐ ‐ ‐ ‐ ‐ ‐ Traffic from each visiting region: data from each province, autonomous region, municipality, and special administrative region in China is supported, and is provided in the form of a pie chart The traffic proportion of each visited region is sorted by traffic size. Currently, the report displays the information of the first five regions, and the total volume of other regions is replaced by "Others".
Specify the flow trend of the visiting area: You can choose to analyze the flow trends brought by the designated area (accurate to the "city" level) in different time periods.
2. Application health
1) API call success rate
Including the last 30 Daily application call success rate trend chart and call number trend chart
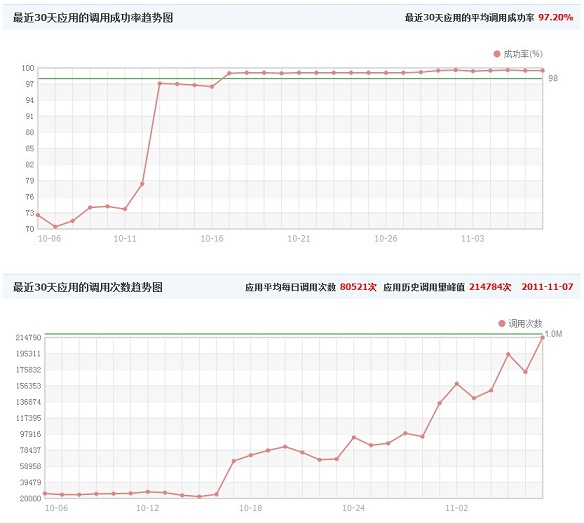
2) API call details
Including API call details report

3) APP availability rate
Including 4XX, 5XX, timeout errors Curve charts and reports
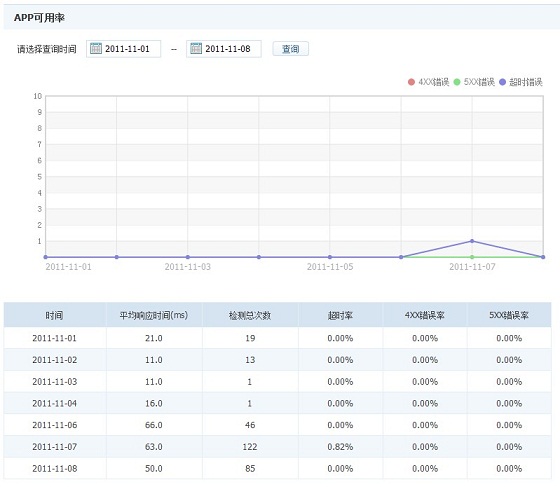
3. Operational reports
1) Income sharing report (Taobao service/Taobao customer tool)
2) Order record query
3) Ordering relationship query
4, Monitoring and warning
Application stability problems are usually most likely to occur on the server side of the application. Problem symptoms generally include the following:
1) Server down
2) Web Server stops service
3) The machine load is too high
4) The computer room network fails
…………
After the above problems occur, the application usually cannot be accessed normally, which is very harmful to the user experience. To solve these problems, the simplest way is to enable TOP to monitor the system status of the application server, so that when server-side stability problems occur, they can promptly detect and send alarms to developers for subsequent response and maintenance processing.
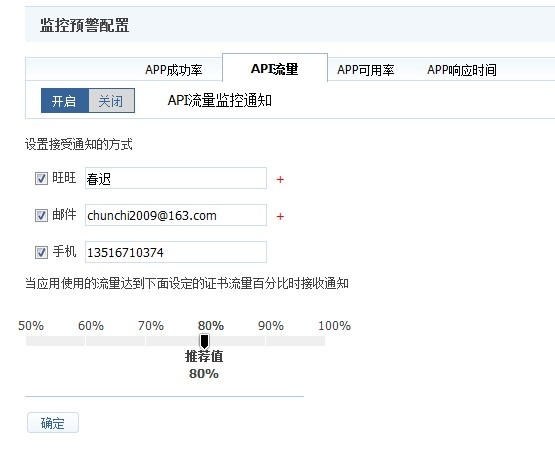
So TOP provides the following four alarm settings
1) APP success rate
2 ) API traffic
3) APP availability rate
4) APP response time
#When the values of each type meet the set threshold, an alarm will be issued according to the alarm method you configured.
FAQ
- There is no FAQ about this document
