Rumah >pembangunan bahagian belakang >Tutorial Python >Masih marah dengan tetapan lapisan Matplotlib yang rumit! ? Datang dan lihat kit alat lukisan Python ini
Masih marah dengan tetapan lapisan Matplotlib yang rumit! ? Datang dan lihat kit alat lukisan Python ini
- Python当打之年ke hadapan
- 2023-08-10 16:00:111553semak imbas
- Pengenalan perpustakaan ProPlot
- Demonstrasi contoh ProPlot
perpustakaan intro
Python-matplotlib untuk melukis carta, tema Warna dan format lalai hanya boleh membantu kami membiasakan diri dengan fungsi lukisan, tetapi jika anda ingin mereka bentuk kerja visualisasi yang sangat baik (sama ada tahap penerbitan atau sedikit artistik), anda perlu biasa dengan sejumlah besar fungsi lukisan, sepertiwarna, skala, paksi, fon dsb., apabila melibatkan lukisan pelbagai subplot, operasi ini akan memakan banyak tenaga, tanpa menyebabkan penulisan kod yang panjang, dan ia juga terdedah kepada ralat . Untuk butiran, anda boleh menyemak artikel saya sebelum ini. Selain itu, jika anda perlu menggunakan matplotlib untuk melukis setiap hari dan sering perlu mencantikkan carta, maka pakej lukisan Proplot sesuai untuk anda, dan jangan risau tentang tidak dapat menyesuaikan diri dengannya , yang sangat Permudahkan fungsi lukisan. Di bawah ini kami akan memperkenalkan secara ringkas kaedah pemasangan dan penggunaan utamanya Jika anda ingin mengetahui lebih lanjut mengenainya, anda boleh pergi ke laman web rasmi. . :
#for pip
pip install proplot
#for conda
conda install -c conda-forge proplot
format() memudahkan kod
Proplot tidak perlu menetapkan setiap sifat plot seperti yang dilakukan oleh matplotlib Fungsi format() menyediakan semua kaedah pemformatan sekaligus untuk menukar semua tetapan. Mari kita ambil contoh mudah, seperti berikut:
Gunakan matplotlib untuk melukis
#for pip
pip install --upgrade proplot
#for conda
conda upgrade proplot
import matplotlib.pyplot as plt
import matplotlib.ticker as mticker
import matplotlib as mpl
with mpl.rc_context(rc={'axes.linewidth': 1, 'axes.color': 'gray'}):
    fig, axs = plt.subplots(ncols=2, sharey=True)
    axs[0].set_ylabel('bar', color='gray')
    for ax in axs:
        ax.set_xlim(0, 100)
        ax.xaxis.set_major_locator(mticker.MultipleLocator(10))
        ax.tick_params(width=1, color='gray', labelcolor='gray')
        ax.tick_params(axis='x', which='minor', bottom=True)
        ax.set_xlabel('foo', color='gray')
Dari contoh mudah ini, anda boleh lihat Proplot. . Berbilang nombor siri sub-gambar ditambah secara automatik. Contoh khusus adalah seperti berikut: import proplot as plot fig, axs = plot.subplots(ncols=2) axs.format(linewidth=1, color='gray') axs.format(xlim=(0, 100), xticks=10, xtickminor=True, xlabel='foo', ylabel='bar')
- Anda juga boleh menetapkan
- style (abcstyle), kedudukan (abcloc), saiz (abcsize)
, dan lain-lain untuk nombor siri. Untuk tetapan terperinci lain, sila rujuk laman web rasmi.
axis Colorbars and legends
# 样本数据
import numpy as np
state = np.random.RandomState(51423)
data = 2 * (state.rand(100, 5) - 0.5).cumsum(axis=0)

import proplot as plot
fig, axs = plot.subplots(ncols=2)
axs[0].plot(data, lw=2)
axs[0].format(xticks=20, xtickminor=False)
axs.format(abc=True,abcstyle='(A)',abcsize=12,abcloc='ul',
    suptitle='Abc label test', title='Title',
    xlabel='x axis', ylabel='y axis'
)
plt.savefig(r'E:\Data_resourses\DataCharm 公众号\Python\学术图表绘制\ProPlot\abc_01.png',
             dpi=900)
Kesannya adalah seperti berikut:
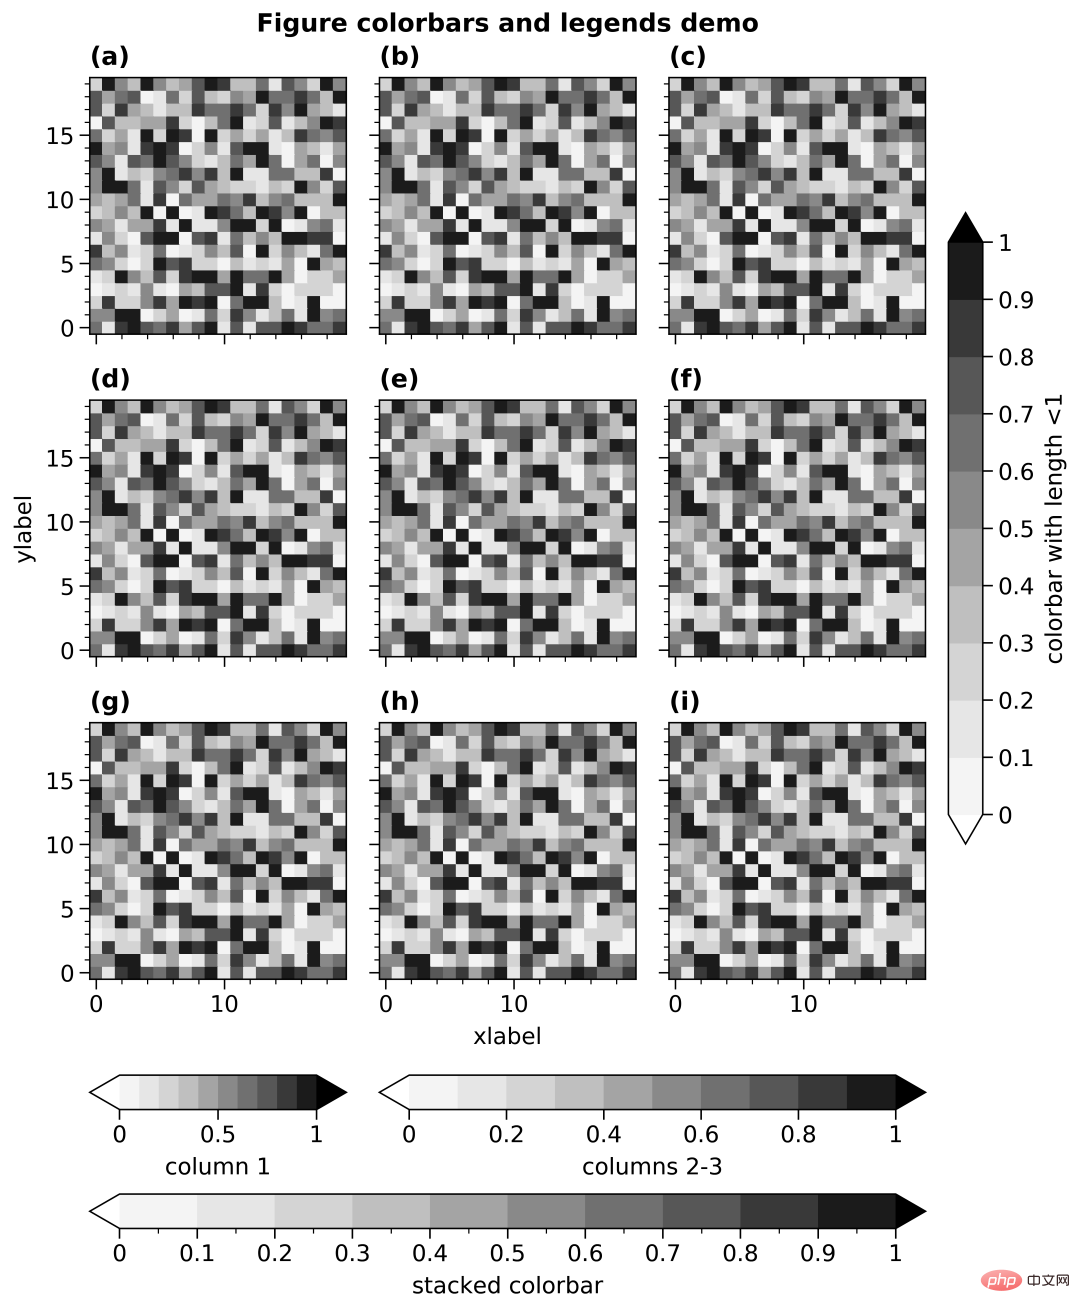
Figure 颜色条和图例
import proplot as plot
import numpy as np
fig, axs = plot.subplots(ncols=3, nrows=3, axwidth=1.4)
state = np.random.RandomState(51423)
m = axs.pcolormesh(
state.rand(20, 20), cmap='grays',
levels=np.linspace(0, 1, 11), extend='both'
)[0]
axs.format(
suptitle='Figure colorbars and legends demo', abc=True,
abcloc='l', abcstyle='(a)', xlabel='xlabel', ylabel='ylabel'
)
fig.colorbar(m, label='column 1', ticks=0.5, loc='b', col=1)
fig.colorbar(m, label='columns 2-3', ticks=0.2, loc='b', cols=(2, 3))
fig.colorbar(m, label='stacked colorbar', ticks=0.1, loc='b', minorticks=0.05)
fig.colorbar(m, label='colorbar with length <1', ticks=0.1, loc='r', length=0.7)效果如下:
时间刻度(Datetime ticks)
Datetime ticks
import proplot as plot
import numpy as np
plot.rc.update(
    linewidth=1.2, fontsize=10, ticklenratio=0.7,
    figurefacecolor='w', facecolor='pastel blue',
    titleloc='upper center', titleborder=False,
)
fig, axs = plot.subplots(nrows=5, axwidth=6, aspect=(8, 1), share=0)
axs[:4].format(xrotation=0)  # no rotation for these examples

# Default date locator
# This is enabled if you plot datetime data or set datetime limits
axs[0].format(
    xlim=(np.datetime64('2000-01-01'), np.datetime64('2001-01-02')),
    title='Auto date locator and formatter'
)

# Concise date formatter introduced in matplotlib 3.1
axs[1].format(
    xlim=(np.datetime64('2000-01-01'), np.datetime64('2001-01-01')),
    xformatter='concise', title='Concise date formatter',
)

# Minor ticks every year, major every 10 years
axs[2].format(
    xlim=(np.datetime64('2000-01-01'), np.datetime64('2050-01-01')),
    xlocator=('year', 10), xformatter='\'%y', title='Ticks every N units',
)

# Minor ticks every 10 minutes, major every 2 minutes
axs[3].format(
    xlim=(np.datetime64('2000-01-01T00:00:00'), np.datetime64('2000-01-01T12:00:00')),
    xlocator=('hour', range(0, 24, 2)), xminorlocator=('minute', range(0, 60, 10)),
    xformatter='T%H:%M:%S', title='Ticks at specific intervals',
)

# Month and year labels, with default tick label rotation
axs[4].format(
    xlim=(np.datetime64('2000-01-01'), np.datetime64('2008-01-01')),
    xlocator='year', xminorlocator='month',  # minor ticks every month
    xformatter='%b %Y', title='Ticks with default rotation',
)
axs.format(
    ylocator='null', suptitle='Datetime locators and formatters demo'
)
plot.rc.reset()
plt.savefig(r'E:\Data_resourses\DataCharm 公众号\Python\学术图表绘制\ProPlot\datetick.png',
             dpi=900)
效果如下:
以上是我认为ProPlot 比较优秀的几点,当然,大家也可以自行探索,发现自己喜欢的技巧。
ProPlot 实例演示
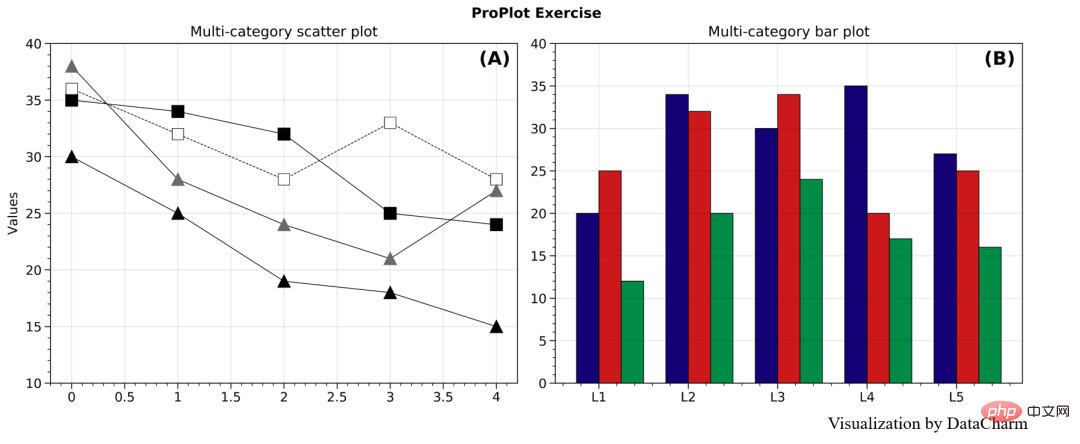
我们使用之前的推文数据进行实例操作,详细代码如下:
#开始绘图
labels = ['L1', 'L2', 'L3', 'L4', 'L5']
data_a = [20, 34, 30, 35, 27]
data_b = [25, 32, 34, 20, 25]
data_c = [12, 20, 24, 17, 16]

x = np.arange(len(labels))
width = .25
fig, axs = plot.subplots(ncols=2, nrows=1, sharey=1, width=10,height=4)
#for mark, data in zip()
axs[0].plot(x,y1, marker='s',c='k',lw=.5,label='D1',markersize=8)
axs[0].plot(x,y2, marker='s',c='k',ls='--',lw=.5,markersize=8,markerfacecolor='white',markeredgewidth=.4,label='D2')
axs[0].plot(x,y3,marker='^',c='k',lw=.5,markersize=8,markerfacecolor='dimgray',markeredgecolor='dimgray',
                     label='D3')
axs[0].plot(x,y4,marker='^',c='k',lw=.5,markersize=8,label='D4')

axs[1].bar(x-width/2, data_a,width,label='category_A',color='#130074',ec='black',lw=.5)
axs[1].bar(x+width/2, data_b, width,label='category_B',color='#CB181B',ec='black',lw=.5)
axs[1].bar(x+width*3/2, data_c,width,label='category_C',color='#008B45',ec='black',lw=.5)

#先对整体进行设置
axs.format(ylim=(0,40),
    xlabel='', ylabel='Values',
    abc=True, abcloc='ur', abcstyle='(A)',abcsize=13,
    suptitle='ProPlot Exercise'
)
#再对每个子图进行设置
axs[0].format(ylim=(10,40),title='Multi-category scatter plot')
axs[1].format(title='Multi-category bar plot',xticklabels=['L1', 'L2', 'L3', 'L4', 'L5'])

plt.savefig(r'E:\Data_resourses\DataCharm 公众号\Python\学术图表绘制\ProPlot\test_01.png',
            dpi=900)
plt.show()
效果如下:
只是简单的绘制,其他的设置也需要熟悉绘图函数,这里就给大家做个简单的演示。
总结
本期推文我们介绍了matplotlib非常优秀的科学图表绘图库PrpPlot, 在一定程度上极大了缩减了定制化绘制时间,感兴趣的同学可以持续关注这个库,当然,还是最好在熟悉matplotlib基本绘图函数及图层属性设置函数的基础上啊。
Atas ialah kandungan terperinci Masih marah dengan tetapan lapisan Matplotlib yang rumit! ? Datang dan lihat kit alat lukisan Python ini. Untuk maklumat lanjut, sila ikut artikel berkaitan lain di laman web China PHP!

