Rumah >pembangunan bahagian belakang >Tutorial Python >Bagaimana untuk melaksanakan fungsi imej kabur penapis lulus rendah dalam Python
Bagaimana untuk melaksanakan fungsi imej kabur penapis lulus rendah dalam Python
- WBOYWBOYWBOYWBOYWBOYWBOYWBOYWBOYWBOYWBOYWBOYWBOYWBke hadapan
- 2023-05-14 17:10:062412semak imbas
Gunakan penapis laluan rendah untuk mengaburkan imej
0. Prakata
Penapis laluan rendah (Low Pass Filter, ) Menapis keluar bahagian frekuensi tinggi imej dan membenarkan hanya bahagian frekuensi rendah melaluinya. Oleh itu, menerapkan LPF pada imej menghilangkan butiran/tepi dan hingar/luar dalam imej Proses ini juga dipanggil kabur imej (atau pelicinan imej boleh digunakan sebagai bahagian pra-pemprosesan tugas pemprosesan imej yang kompleks. LPF
- Kabur Tepi (
) Jenis kabur ini biasanya digunakan secara eksplisit pada imej melalui lilitan, seperti kernel penapis linear atau kernel Gaussian, dsb. Inti penapis ini boleh digunakan untuk melicinkan/mengalih keluar elemen yang tidak diperlukan dalam imej.
Edge - Kabur pergerakan (
) biasanya disebabkan oleh goncangan kamera semasa menangkap imej, iaitu kamera atau subjek yang diambil gambar sedang bergerak. Kita boleh menggunakan fungsi penyebaran titik untuk mensimulasikan kekaburan ini.
Motion - Kabur Tidak Fokus (
) Jenis kabur ini berlaku apabila objek yang ditangkap oleh kamera tidak fokus; kita boleh menggunakan Kabur (
de-focus) kernel untuk mensimulasikan jenis samar-samar ini.blur
(1) Kami mula-mula mentakrifkan fungsi untuk mengembalikan get_gaussian_edge_blur_kernel() kernel Gaussian blur untuk kekaburan tepi. Fungsi ini menerima sisihan piawai Gaussian (σ Seperti yang ditunjukkan di bawah, mula-mula 2D kernel Gaussian dicipta, kemudian hasil keluaran luar dua 2D kernel Gaussian dikira untuk mengembalikan kernel sz = 15: 15x15
import numpy as np
import numpy.fft as fp
from skimage.io import imread
from skimage.color import rgb2gray
import matplotlib.pyplot as plt
import cv2

def get_gaussian_edge_blur_kernel(sigma, sz=15):
    # First create a 1-D Gaussian kernel
    x = np.linspace(-10, 10, sz)
    kernel_1d = np.exp(-x**2/sigma**2)
    kernel_1d /= np.trapz(kernel_1d) # normalize the sum to 1.0
    # create a 2-D Gaussian kernel from the 1-D kernel
    kernel_2d = kernel_1d[:, np.newaxis] * kernel_1d[np.newaxis, :]
return kernel_2d1D1D(2)2D Seterusnya, takrifkan fungsi untuk menjana kernel kabur gerakan, dan dapatkan garis dengan panjang tertentu dan arah tertentu (sudut) sebagai kernel konvolusi untuk mensimulasikan kesan kabur gerakan imej input: def get_motion_blur_kernel(ln, angle, sz=15):
kern = np.ones((1, ln), np.float32)
angle = -np.pi*angle/180
c, s = np.cos(angle), np.sin(angle)
A = np.float32([[c, -s, 0], [s, c, 0]])
sz2 = sz // 2
A[:,2] = (sz2, sz2) - np.dot(A[:,:2], ((ln-1)*0.5, 0))
kern = cv2.warpAffine(kern, A, (sz, sz), flags=cv2.INTER_CUBIC)
return kern Fungsi akan Panjang dan sudut kabur dan saiz kernel kabur digunakan sebagai parameter, dan fungsi menggunakan fungsi get_motion_blur_kernel() untuk mengembalikan matriks kernel (mengambil bahagian tengah matriks sebagai titik tengah, menggunakan panjang yang diberikan dan sudut yang diberikan untuk mendapatkan kernel). get_motion_blur_kernel()OpenCV(3)warpaffine() Akhir sekali, takrifkan fungsi
() dan saiz kernel untuk dijana sebagai parameter input:
 def get_out_of_focus_kernel(r, sz=15):
    kern = np.zeros((sz, sz), np.uint8)
    cv2.circle(kern, (sz, sz), r, 255, -1, cv2.LINE_AA, shift=1)
    kern = np.float32(kern) / 255
return kernget_out_of_focus_kernel()R(4)Deocus Radius Seterusnya, laksanakan fungsi , yang menggunakan pendaraban Element-wise imej dan kernel lilitan dalam domain frekuensi melaksanakan lilitan domain frekuensi (berdasarkan teorem lilitan). Fungsi ini juga memplot imej input, kernel dan imej output yang terhasil daripada pengiraan konvolusi: def dft_convolve(im, kernel):
F_im = fp.fft2(im)
#F_kernel = fp.fft2(kernel, s=im.shape)
F_kernel = fp.fft2(fp.ifftshift(kernel), s=im.shape)
F_filtered = F_im * F_kernel
im_filtered = fp.ifft2(F_filtered)
cmap = 'RdBu'
plt.figure(figsize=(20,10))
plt.gray()
plt.subplot(131), plt.imshow(im), plt.axis('off'), plt.title('input image', size=10)
plt.subplot(132), plt.imshow(kernel, cmap=cmap), plt.title('kernel', size=10)
plt.subplot(133), plt.imshow(im_filtered.real), plt.axis('off'), plt.title('output image', size=10)
plt.tight_layout()
plt.show()(5)dft_convolve() Gunakan fungsi kernel pada imej dan plot input, kernel dan Output imej kabur: im = rgb2gray(imread('3.jpg')) kernel = get_gaussian_edge_blur_kernel(25, 25) dft_convolve(im, kernel)(6)
get_gaussian_edge_blur_kernel() Seterusnya, gunakan fungsi pada imej dan plot imej kabur input, kernel dan output: kernel = get_motion_blur_kernel(30, 60, 25) dft_convolve(im, kernel)(7)
get_motion_blur_kernel() Akhir sekali, gunakan fungsi pada imej dan lukis imej kabur input, kernel dan output: kernel = get_out_of_focus_kernel(15, 20) dft_convolve(im, kernel)2 Gunakan penapis scipy.ndimage untuk mengaburkan imej
get_out_of_focus_kernel() menyediakan satu siri fungsi yang menggunakan penapis laluan rendah pada imej dalam domain frekuensi. Dalam bahagian ini, kita belajar cara menggunakan beberapa penapis ini melalui beberapa contoh.
2.1 Menggunakan fungsi fourier_gaussian()
Gunakan fungsi scipy.ndimage daripada pustaka
(1)scipy.ndimage Mula-mula, baca imej input, tukarkannya kepada imej skala kelabu dan dapatkan perwakilan domain frekuensinya dengan menggunakan fourier_gaussian():
import numpy as np
import numpy.fft as fp
from skimage.io import imread
import matplotlib.pyplot as plt
from scipy import ndimage

im = imread('1.png', as_gray=True)
freq = fp.fft2(im)
(2) Seterusnya, gunakan fungsi FFT untuk melaksanakan operasi kabur pada imej, menggunakan dua kernel Gaussian dengan sisihan piawai yang berbeza, dan plot imej input dan output serta spektrum kuasa:
fig, axes = plt.subplots(2, 3, figsize=(20,15))
plt.subplots_adjust(0,0,1,0.95,0.05,0.05)
plt.gray() # show the filtered result in grayscale
axes[0, 0].imshow(im), axes[0, 0].set_title('Original Image', size=10)
axes[1, 0].imshow((20*np.log10( 0.1 + fp.fftshift(freq))).real.astype(int)), axes[1, 0].set_title('Original Image Spectrum', size=10)
i = 1
for sigma in [3,5]:
    convolved_freq = ndimage.fourier_gaussian(freq, sigma=sigma)
    convolved = fp.ifft2(convolved_freq).real # the imaginary part is an artifact
    axes[0, i].imshow(convolved)
    axes[0, i].set_title(r'Output with FFT Gaussian Blur, $\sigma$={}'.format(sigma), size=10)
    axes[1, i].imshow((20*np.log10( 0.1 + fp.fftshift(convolved_freq))).real.astype(int))
    axes[1, i].set_title(r'Spectrum with FFT Gaussian Blur, $\sigma$={}'.format(sigma), size=10)
    i += 1
for a in axes.ravel():
    a.axis('off')
plt.show()
2.2 Gunakan fungsi fourier_uniform() fourier_gaussian() fungsi
(penapis min).
scipy.ndimage(1)fourier_uniform() Mula-mula, baca imej input dan gunakan LPF untuk mendapatkan perwakilan domain frekuensinya:
im = imread('1.png', as_gray=True)
freq = fp.fft2(im)
(2) 然后,使用函数 fourier_uniform() 应用 10x10 方形核(由功率谱上的参数指定),以获取平滑输出:
freq_uniform = ndimage.fourier_uniform(freq, size=10)
(3) 绘制原始输入图像和模糊后的图像:
fig, (axes1, axes2) = plt.subplots(1, 2, figsize=(20,10))
plt.gray() # show the result in grayscale
im1 = fp.ifft2(freq_uniform)
axes1.imshow(im), axes1.axis('off')
axes1.set_title('Original Image', size=10)
axes2.imshow(im1.real) # the imaginary part is an artifact
axes2.axis('off')
axes2.set_title('Blurred Image with Fourier Uniform', size=10)
plt.tight_layout()
plt.show()
(4) 最后,绘制显示方形核的功率谱:
plt.figure(figsize=(10,10))
plt.imshow( (20*np.log10( 0.1 + fp.fftshift(freq_uniform))).real.astype(int))
plt.title('Frequency Spectrum with fourier uniform', size=10)
plt.show()
2.3 使用 fourier_ellipsoid() 函数
与上一小节类似,通过将方形核修改为椭圆形核,我们可以使用椭圆形核生成模糊的输出图像。
(1) 类似的,我们首先在图像的功率谱上应用函数 fourier_ellipsoid(),并使用 IDFT 在空间域中获得模糊后的输出图像:
freq_ellipsoid = ndimage.fourier_ellipsoid(freq, size=10)
im1 = fp.ifft2(freq_ellipsoid)
(2) 接下来,绘制原始输入图像和模糊后的图像:
fig, (axes1, axes2) = plt.subplots(1, 2, figsize=(20,10))
axes1.imshow(im), axes1.axis('off')
axes1.set_title('Original Image', size=10)
axes2.imshow(im1.real) # the imaginary part is an artifact
axes2.axis('off')
axes2.set_title('Blurred Image with Fourier Ellipsoid', size=10)
plt.tight_layout()
plt.show()
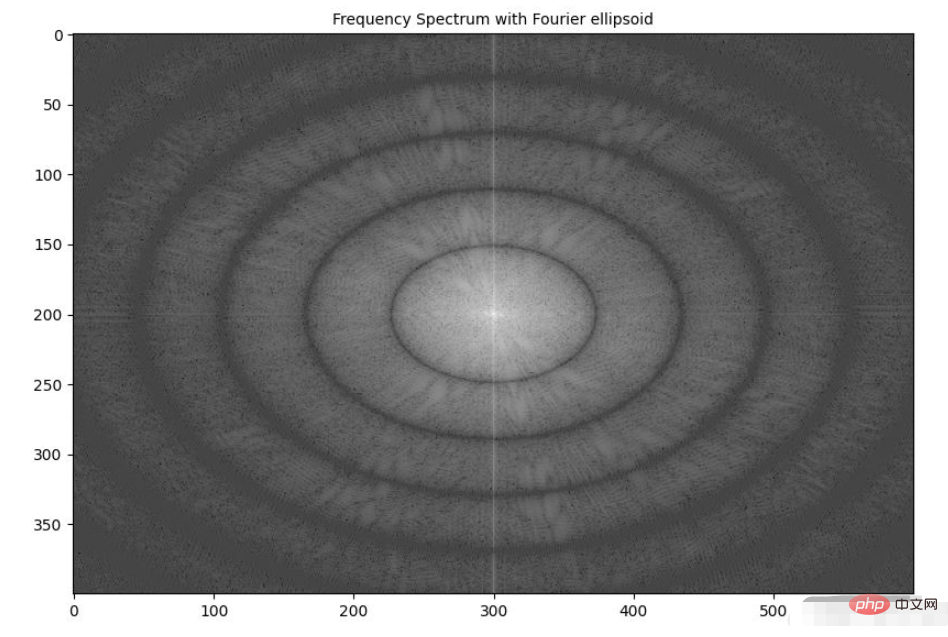
(3) 最后,显示应用椭圆形核后图像的频谱:
plt.figure(figsize=(10,10))
plt.imshow( (20*np.log10( 0.1 + fp.fftshift(freq_ellipsoid))).real.astype(int))
plt.title('Frequency Spectrum with Fourier ellipsoid', size=10)
plt.show()

3. 使用 scipy.fftpack 实现高斯模糊
我们已经学习了如何在实际应用中使用 numpy.fft 模块的 2D-FFT。在本节中,我们将介绍 scipy.fftpack 模块的 fft2() 函数用于实现高斯模糊。
(1) 使用灰度图像作为输入,并使用 FFT 从图像中创建 2D 频率响应数组:
import numpy as np
import numpy.fft as fp
from skimage.color import rgb2gray
from skimage.io import imread
import matplotlib.pyplot as plt
from scipy import signal
from matplotlib.ticker import LinearLocator, FormatStrFormatter

im = rgb2gray(imread('1.png'))
freq = fp.fft2(im)
(2) 通过计算两个 1D 高斯核的外积,在空间域中创建高斯 2D 核用作 LPF:
kernel = np.outer(signal.gaussian(im.shape[0], 1), signal.gaussian(im.shape[1], 1))
(3) 使用 DFT 获得高斯核的频率响应:
freq_kernel = fp.fft2(fp.ifftshift(kernel))
(4) 使用卷积定理通过逐元素乘法在频域中将 LPF 与输入图像卷积:
convolved = freq*freq_kernel # by the Convolution theorem
(5) 使用 IFFT 获得输出图像,需要注意的是,要正确显示输出图像,需要缩放输出图像:
im_blur = fp.ifft2(convolved).real
im_blur = 255 * im_blur / np.max(im_blur)
(6) 绘制图像、高斯核和在频域中卷积后获得图像的功率谱,可以使用 matplotlib.colormap 绘制色,以了解不同坐标下的频率响应值:
plt.figure(figsize=(20,20))
plt.subplot(221), plt.imshow(kernel, cmap='coolwarm'), plt.colorbar()
plt.title('Gaussian Blur Kernel', size=10)
plt.subplot(222)
plt.imshow( (20*np.log10( 0.01 + fp.fftshift(freq_kernel))).real.astype(int), cmap='inferno')
plt.colorbar()
plt.title('Gaussian Blur Kernel (Freq. Spec.)', size=10)
plt.subplot(223), plt.imshow(im, cmap='gray'), plt.axis('off'), plt.title('Input Image', size=10)
plt.subplot(224), plt.imshow(im_blur, cmap='gray'), plt.axis('off'), plt.title('Output Blurred Image', size=10)
plt.tight_layout()
plt.show()
(7) 要绘制输入/输出图像和 3D 核的功率谱,我们定义函数 plot_3d(),使用 mpl_toolkits.mplot3d 模块的 plot_surface() 函数获取 3D 功率谱图,给定相应的 Y 和Z值作为 2D 阵列传递:
def plot_3d(X, Y, Z, cmap=plt.cm.seismic):
    fig = plt.figure(figsize=(20,20))
    ax = fig.gca(projection='3d')
    # Plot the surface.
    surf = ax.plot_surface(X, Y, Z, cmap=cmap, linewidth=5, antialiased=False)
    #ax.plot_wireframe(X, Y, Z, rstride=10, cstride=10)
    #ax.set_zscale("log", nonposx='clip')
    #ax.zaxis.set_scale('log')
    ax.zaxis.set_major_locator(LinearLocator(10))
    ax.zaxis.set_major_formatter(FormatStrFormatter('%.02f'))
    ax.set_xlabel('F1', size=15)
    ax.set_ylabel('F2', size=15)
    ax.set_zlabel('Freq Response', size=15)
    #ax.set_zlim((-40,10))
    # Add a color bar which maps values to colors.
    fig.colorbar(surf) #, shrink=0.15, aspect=10)
    #plt.title('Frequency Response of the Gaussian Kernel')
    plt.show()
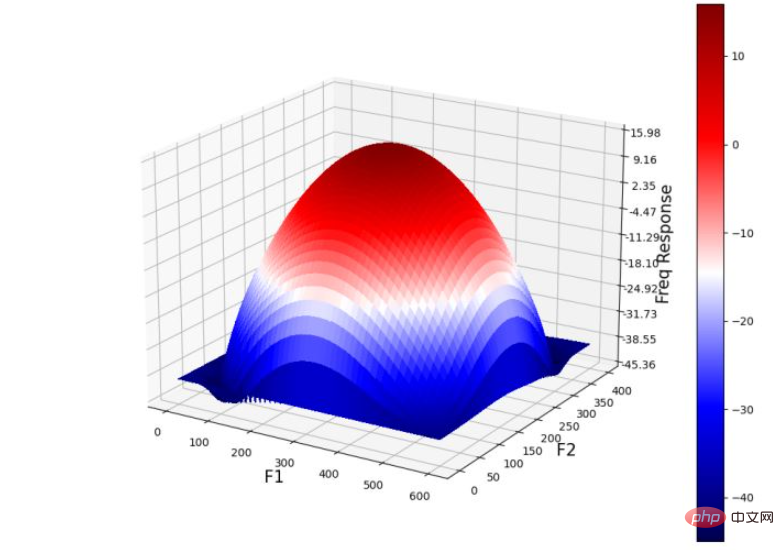
(8) 在 3D 空间中绘制高斯核的频率响应,并使用 plot_3d() 函数:
Y = np.arange(freq.shape[0]) #-freq.shape[0]//2,freq.shape[0]-freq.shape[0]//2)
X = np.arange(freq.shape[1]) #-freq.shape[1]//2,freq.shape[1]-freq.shape[1]//2)
X, Y = np.meshgrid(X, Y)
Z = (20*np.log10( 0.01 + fp.fftshift(freq_kernel))).real
plot_3d(X,Y,Z)
下图显示了 3D 空间中高斯 LPF 核的功率谱:

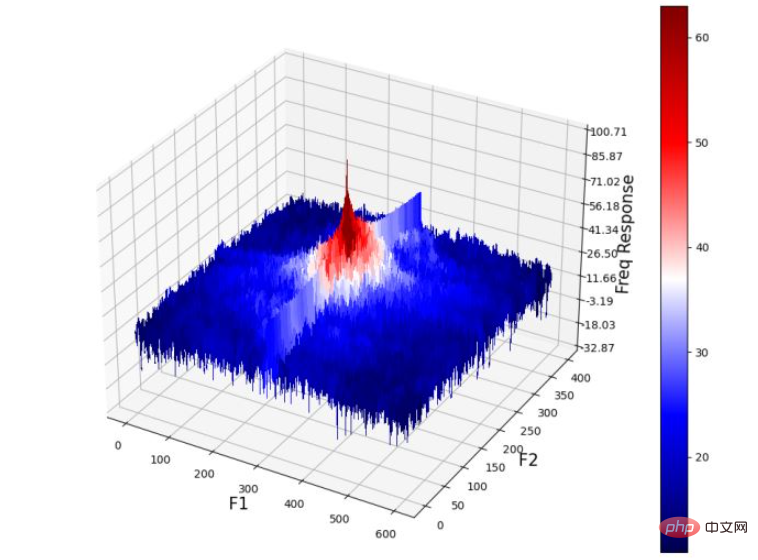
(9) 绘制 3D 空间中输入图像的功率谱:
Z = (20*np.log10( 0.01 + fp.fftshift(freq))).real
plot_3d(X,Y,Z)

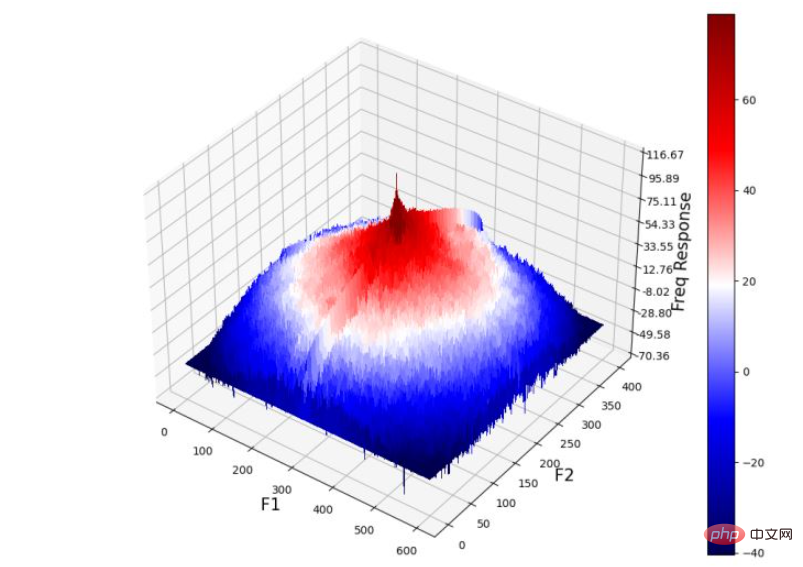
(10) 最后,绘制输出图像的功率谱(通过将高斯核与输入图像卷积获得):
Z = (20*np.log10( 0.01 + fp.fftshift(convolved))).real
plot_3d(X,Y,Z)

从输出图像的频率响应中可以看出,高频组件被衰减,从而导致细节的平滑/丢失,并导致输出图像模糊。
4. 彩色图像频域卷积
在本节中,我们将学习使用 scipy.signal 模块的 fftconvolve() 函数,用于与 RGB 彩色输入图像进行频域卷积,从而生成 RGB 彩色模糊输出图像:
scipy.signal.fftconvolve(in1, in2, mode='full', axes=None)
函数使用 FFT 卷积两个 n 维数组 in1 和 in2,并由 mode 参数确定输出大小。卷积模式 mode 具有以下类型:
输出是输入的完全离散线性卷积,默认情况下使用此种卷积模式
输出仅由那些不依赖零填充的元素组成,
in1或in2的尺寸必须相同输出的大小与
in1相同,并以输出为中心
4.1 基于 scipy.signal 模块的彩色图像频域卷积
接下来,我们实现高斯低通滤波器并使用 Laplacian 高通滤波器执行相应操作。
(1) 首先,导入所需的包,并读取输入 RGB 图像:
from skimage import img_as_float
from scipy import signal
import numpy as np
import matplotlib.pyplot as plt

im = img_as_float(plt.imread('1.png'))
(2) 实现函数 get_gaussian_edge_kernel(),并根据此函数创建一个尺寸为 15x15 的高斯核:
def get_gaussian_edge_blur_kernel(sigma, sz=15):
    # First create a 1-D Gaussian kernel
    x = np.linspace(-10, 10, sz)
    kernel_1d = np.exp(-x**2/sigma**2)
    kernel_1d /= np.trapz(kernel_1d) # normalize the sum to 1.0
    # create a 2-D Gaussian kernel from the 1-D kernel
    kernel_2d = kernel_1d[:, np.newaxis] * kernel_1d[np.newaxis, :]
    return kernel_2d
kernel = get_gaussian_edge_blur_kernel(sigma=10, sz=15)
(3) 然后,使用 np.newaxis 将核尺寸重塑为 15x15x1,并使用 same 模式调用函数 signal.fftconvolve():
im1 = signal.fftconvolve(im, kernel[:, :, np.newaxis], mode='same')
im1 = im1 / np.max(im1)
在以上代码中使用的 mode='same',可以强制输出形状与输入阵列形状相同,以避免边框效应。
(4) 接下来,使用 laplacian HPF 内核,并使用相同函数执行频域卷积。需要注意的是,我们可能需要缩放/裁剪输出图像以使输出值保持像素的浮点值范围 [0,1] 内:
kernel = np.array([[0,-1,0],[-1,4,-1],[0,-1,0]])
im2 = signal.fftconvolve(im, kernel[:, :, np.newaxis], mode='same')
im2 = im2 / np.max(im2)
im2 = np.clip(im2, 0, 1)
(5) 最后,绘制输入图像和使用卷积创建的输出图像。
plt.figure(figsize=(20,10))
plt.subplot(131), plt.imshow(im), plt.axis('off'), plt.title('original image', size=10)
plt.subplot(132), plt.imshow(im1), plt.axis('off'), plt.title('output with Gaussian LPF', size=10)
plt.subplot(133), plt.imshow(im2), plt.axis('off'), plt.title('output with Laplacian HPF', size=10)
plt.tight_layout()
plt.show()
Atas ialah kandungan terperinci Bagaimana untuk melaksanakan fungsi imej kabur penapis lulus rendah dalam Python. Untuk maklumat lanjut, sila ikut artikel berkaitan lain di laman web China PHP!

