Rumah >Peranti teknologi >AI >Perlombongan data e-dagang berdasarkan pembelajaran mesin |
Perlombongan data e-dagang berdasarkan pembelajaran mesin |
- 王林ke hadapan
- 2023-04-11 23:31:011028semak imbas
Artikel ini dicetak semula daripada akaun awam WeChat "Youerhut", yang ditulis oleh Youerhut. Untuk mencetak semula artikel ini, sila hubungi akaun awam Youerhut.
Hello semua, nama saya Peter~
Baru-baru ini saya memperoleh sekeping data e-dagang produk elektronik IC Saya akan menjalankan analisis data dan perlombongan pada 3 topik kemudian:
- Peringkat pertama: analisis visualisasi statistik berdasarkan panda, numpy, matplotlib, seaborn, plotly dan perpustakaan lain
- Peringkat kedua: analisis potret pengguna berdasarkan algoritma pengelompokan pembelajaran mesin dan model RFM
- Peringkat ketiga: Perlombongan korelasi kategori jenama, produk dan produk berdasarkan algoritma peraturan persatuan
Artikel ini ialah peringkat pertama, dan kandungan utama termasuk:
- Pemprosesan Penyediaan Data
- EDA penerokaan data
- Analisis perbandingan berbilang sudut

Import perpustakaan
Dalam [1]:
import pandas as pd
import numpy as np

import time
import os
from datetime import datetime
import matplotlib.pyplot as plt
import seaborn as sns
%matplotlib inline
#设置中文编码和负号的正常显示
plt.rcParams['font.sans-serif']=['SimHei']
plt.rcParams['axes.unicode_minus']=False

import plotly_express as px
import plotly.graph_objects as go

import missingno as ms

from sklearn.cluster import KMeans
from sklearn.preprocessing import MinMaxScaler
Maklumat asas data
Baca data
df = pd.read_csv(
"ic_sale.csv",
 encoding="utf-8",# 指定编码
 cnotallow={"order_id":str,"product_id":str,"category_id":str,"user_id":str} # 指定字段类型
)
df.head()
Peranan parameter penukar: semua medan id berbilang dalam data Ia adalah nombor, yang dianggap sebagai nombor (dinyatakan dalam notasi saintifik) dalam fail csv atau excel pada dasarnya ia adalah maklumat "rentetan" dan tidak mempunyai sebarang makna saiz; Anda perlu menentukan jenis semasa membaca.

Maklumat asas
Selepas membaca dalam, semak maklumat asas data:
Dalam [3 ]:
# 1、数据shape

df.shape
Keluar[3]:
(564169, 11)
Dalam [4]:
# 2、数据字段类型

df.dtypes
Keluar[4]:
event_timeobject
order_idobject
product_idobject
category_id object
category_code object
brand object
pricefloat64
user_id object
ageint64
sex object
local object
dtype: object
Dalam [5]:
Statistik deskriptif adalah untuk medan angka:
# 3、数据描述统计信息

df.describe()
Keluar[5]:
harga |
umur |
||||||||||||||||||||||||||||||||||||||||||||||||||||||||||||||||||||||||||||||||||||||||||||||||||||||||||||||||||||||||||||||||||||||||||||||||||||||||||||||||||||||||||||||||||||||||||||||||||||||||||||||||||||||||||||||||||||||||||||||||||||||||||||||||||||||||||||||||||||||||||||||||||||||||||||||||||||||||||||||||||||||||||||||||||||||||||||||||||||||||||||||||||||||||||||||||||||||||||||||||||||||||||||||||||
kira |
564169.000000 |
564169.00000> |
|||||||||||||||||||||||||||||||||||||||||||||||||||||||||||||||||||||||||||||||||||||||||||||||||||||||||||||||||||||||||||||||||||||||||||||||||||||||||||||||||||||||||||||||||||||||||||||||||||||||||||||||||||||||||||||||||||||||||||||||||||||||||||||||||||||||||||||||||||||||||||||||||||||||||||||||||||||||||||||||||||||||||||||||||||||||||||||||||||||||||||||||||||||||||||||||||||||||||||||||||||||||||||||||||
| min | 208.269324 | 33.184388 | |||||||||||||||||||||||||||||||||||||||||||||||||||||||||||||||||||||||||||||||||||||||||||||||||||||||||||||||||||||||||||||||||||||||||||||||||||||||||||||||||||||||||||||||||||||||||||||||||||||||||||||||||||||||||||||||||||||||||||||||||||||||||||||||||||||||||||||||||||||||||||||||||||||||||||||||||||||||||||||||||||||||||||||||||||||||||||||||||||||||||||||||||||||||||||||||||||||||||||||||||||||||||||||||||
| std | 304.559875 |
10.122088 |
|||||||||||||||||||||||||||||||||||||||||||||||||||||||||||||||||||||||||||||||||||||||||||||||||||||||||||||||||||||||||||||||||||||||||||||||||||||||||||||||||||||||||||||||||||||||||||||||||||||||||||||||||||||||||||||||||||||||||||||||||||||||||||||||||||||||||||||||||||||||||||||||||||||||||||||||||||||||||||||||||||||||||||||||||||||||||||||||||||||||||||||||||||||||||||||||||||||||||||||||||||||||||||||||||
min |
0.000000 | 16.000000 | |||||||||||||||||||||||||||||||||||||||||||||||||||||||||||||||||||||||||||||||||||||||||||||||||||||||||||||||||||||||||||||||||||||||||||||||||||||||||||||||||||||||||||||||||||||||||||||||||||||||||||||||||||||||||||||||||||||||||||||||||||||||||||||||||||||||||||||||||||||||||||||||||||||||||||||||||||||||||||||||||||||||||||||||||||||||||||||||||||||||||||||||||||||||||||||||||||||||||||||||||||||||||||||||||
| 25% | > |
24.000000 |
|||||||||||||||||||||||||||||||||||||||||||||||||||||||||||||||||||||||||||||||||||||||||||||||||||||||||||||||||||||||||||||||||||||||||||||||||||||||||||||||||||||||||||||||||||||||||||||||||||||||||||||||||||||||||||||||||||||||||||||||||||||||||||||||||||||||||||||||||||||||||||||||||||||||||||||||||||||||||||||||||||||||||||||||||||||||||||||||||||||||||||||||||||||||||||||||||||||||||||||||||||||||||||||||||
50% |
00.00. |
33.000000 | |||||||||||||||||||||||||||||||||||||||||||||||||||||||||||||||||||||||||||||||||||||||||||||||||||||||||||||||||||||||||||||||||||||||||||||||||||||||||||||||||||||||||||||||||||||||||||||||||||||||||||||||||||||||||||||||||||||||||||||||||||||||||||||||||||||||||||||||||||||||||||||||||||||||||||||||||||||||||||||||||||||||||||||||||||||||||||||||||||||||||||||||||||||||||||||||||||||||||||||||||||||||||||||||||
| 75% | 277.75000042.000000 | ||||||||||||||||||||||||||||||||||||||||||||||||||||||||||||||||||||||||||||||||||||||||||||||||||||||||||||||||||||||||||||||||||||||||||||||||||||||||||||||||||||||||||||||||||||||||||||||||||||||||||||||||||||||||||||||||||||||||||||||||||||||||||||||||||||||||||||||||||||||||||||||||||||||||||||||||||||||||||||||||||||||||||||||||||||||||||||||||||||||||||||||||||||||||||||||||||||||||||||||||||||||||||||||||||
| 18328.680000 | 50.000000 |
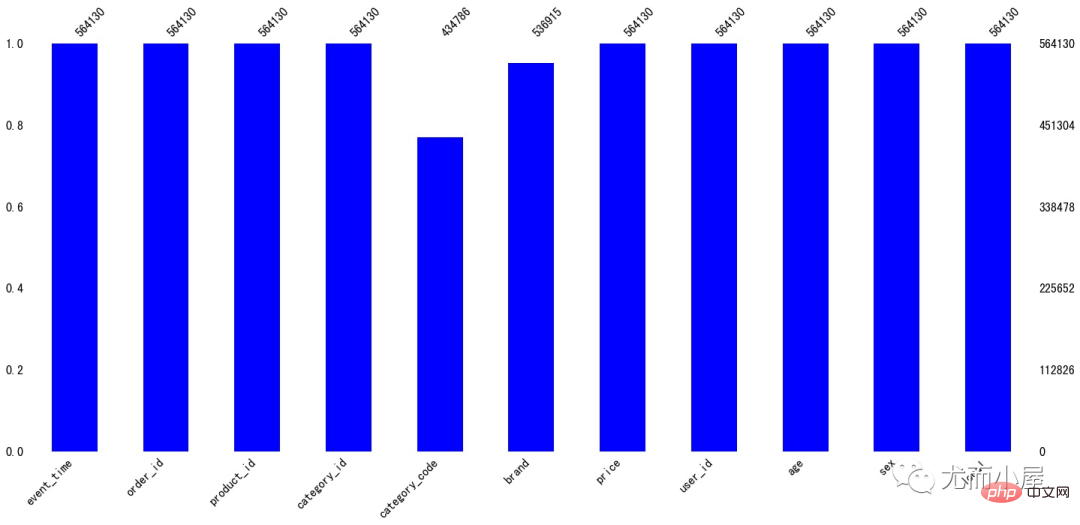
In [6]: # 4、总共多少个不同客户 df["user_id"].nunique() Out[6]: 6908 In [7]: # 5、总共多少个不同品牌 df["brand"].nunique() Out[7]: 868 In [8]: # 6、总共多少个订单 df["order_id"].nunique() Out[8]: 234232 In [9]: # 7、总共多少个产品 df["product_id"].nunique() Out[9]: 3756 数据预处理数据筛选从描述统计信息中发现price字段的最小值是0,应该是没有成交的数据;我们选择price大于0的信息: In [10]: df = df[df["price"] > 0] 缺失值处理缺失值情况In [11]: df.isnull().sum() Out[11]: event_time0 order_id0 product_id0 category_id 0 category_code129344 brand 27215 price 0 user_id 0 age 0 sex 0 local 0 dtype: int64 可以看到缺失值体现在字段:
In [12]: ms.bar(df,color="blue")# 缺失值可视化 plt.show()
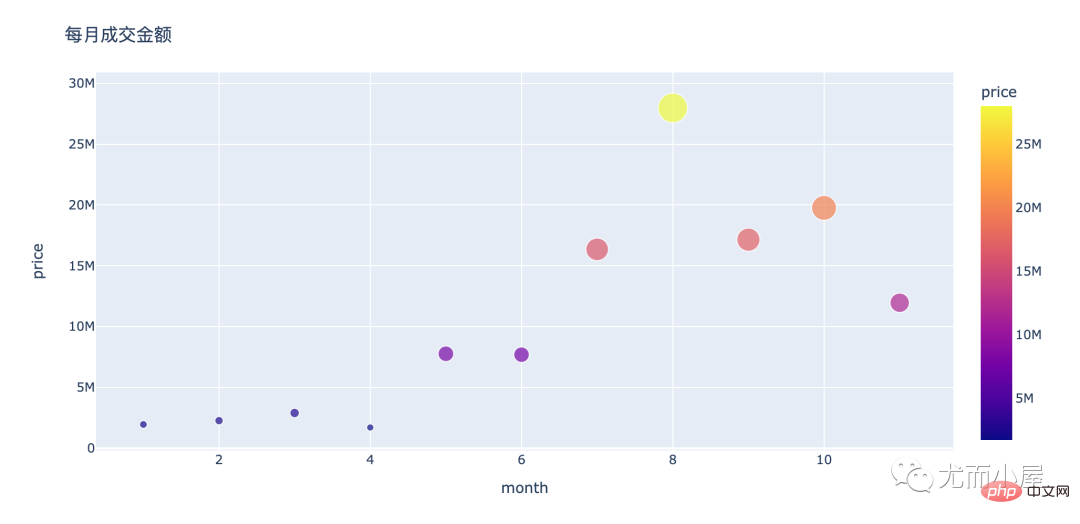
缺失值填充In [13]: df.fillna("missing",inplace=True)In [14]: df.isnull().sum()# 填充之后无缺失值 Out[14]: event_time 0 order_id 0 product_id 0 category_id0 category_code0 brand0 price0 user_id0 age0 sex0 local0 dtype: int64 时间字段处理字段类型转化读进来的数据中时间字段是object类型,需要将其转成时间格式的类型 In [15]: df["event_time"][:5] # 处理前 Out[15]: 02020-04-24 11:50:39 UTC 12020-04-24 11:50:39 UTC 22020-04-24 14:37:43 UTC 32020-04-24 14:37:43 UTC 42020-04-24 19:16:21 UTC Name: event_time, dtype: object In [16]: # 去掉最后的UTC df["event_time"] = df["event_time"].apply(lambda x: x[:19]) In [17]: # 时间数据类型转化:字符类型---->指定时间格式 df['event_time'] = pd.to_datetime(df['event_time'], format="%Y-%m-%d %H:%M:%S") 字段衍生In [18]: # 提取多个时间相关字段 df['month']=df['event_time'].dt.month df['day'] = df['event_time'].dt.day df['dayofweek']=df['event_time'].dt.dayofweek df['hour']=df['event_time'].dt.hour In [19]: df["event_time"][:5] # 处理后 Out[19]: 0 2020-04-24 11:50:39 1 2020-04-24 11:50:39 2 2020-04-24 14:37:43 3 2020-04-24 14:37:43 4 2020-04-24 19:16:21 Name: event_time, dtype: datetime64[ns] 可以看到字段类型已经发生了变化 整体趋势分析分析1:每月成交金额多少?In [20]: amount_by_month = df.groupby("month")["price"].sum().reset_index()
amount_by_monthOut[20]:
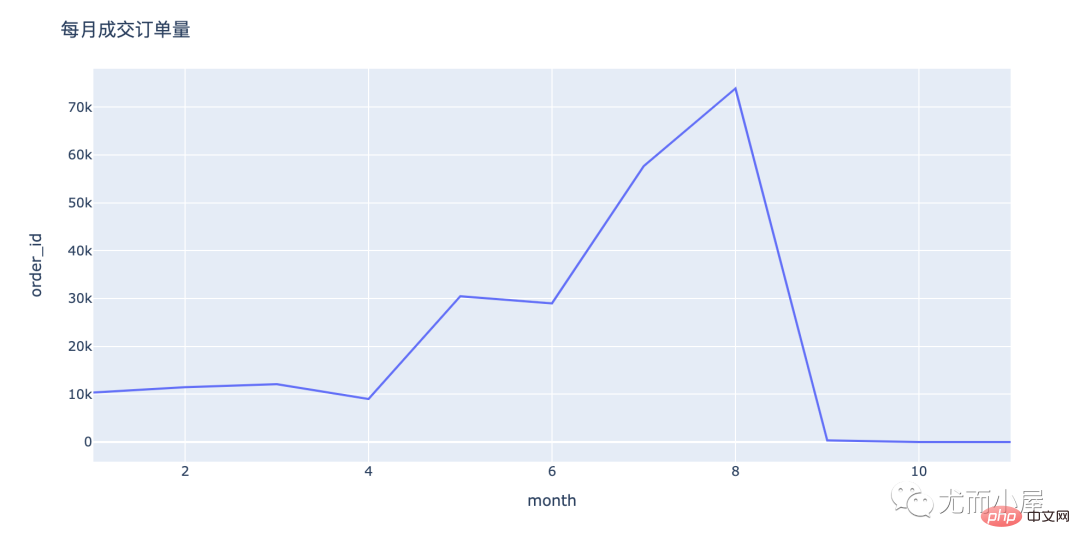
In [23]: fig = px.line(order_by_month,x="month",y="order_id") fig.update_layout(height=500, width=1000, title_text="每月成交订单量") fig.show()
关于订单量:
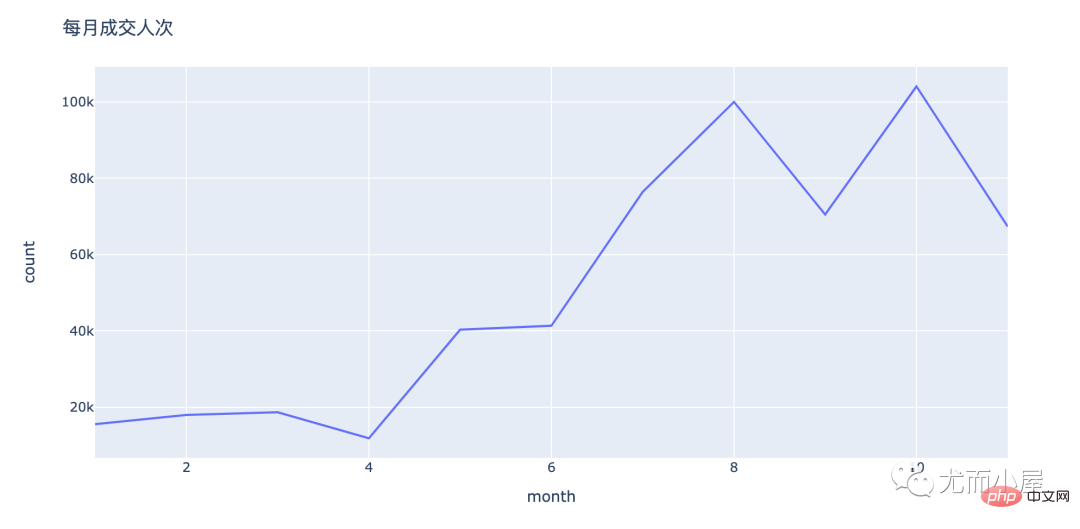
分析3:月消费人数/人次如何变化?In [24]: # nunique:对每个user_id进行去重:消费人数
# count:统计user_id 的次数;消费人次(存在一人多次购买)
people_by_month = df.groupby("month")["user_id"].agg(["nunique","count"]).reset_index()
people_by_monthOut[24]:
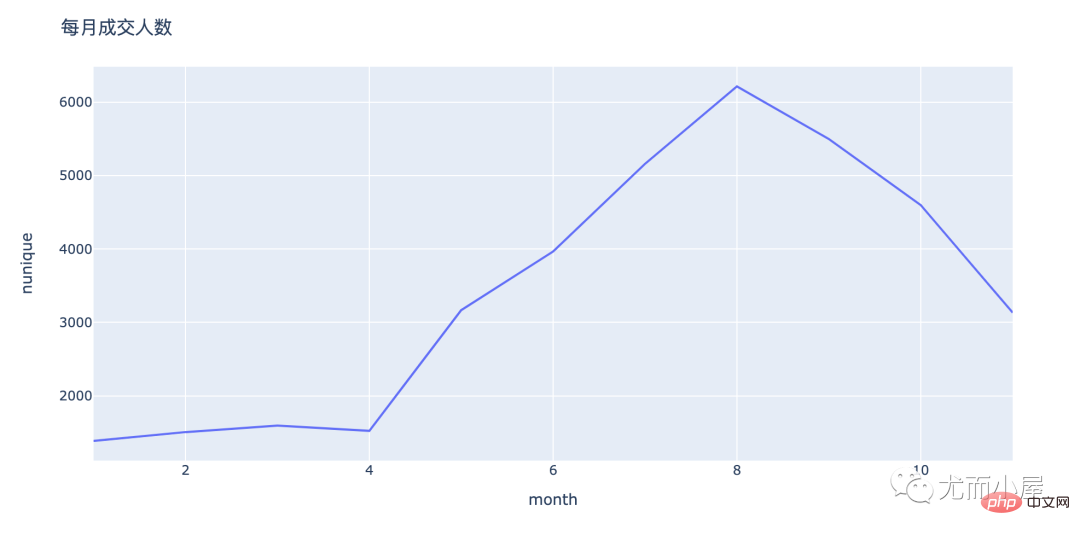
In [25]: fig = px.line(people_by_month,x="month",y="nunique") fig.update_layout(height=500, width=1000, title_text="每月成交人数") fig.show()
fig = px.line(people_by_month,x="month",y="count")

fig.update_layout(height=500, width=1000, title_text="每月成交人次")

fig.show()
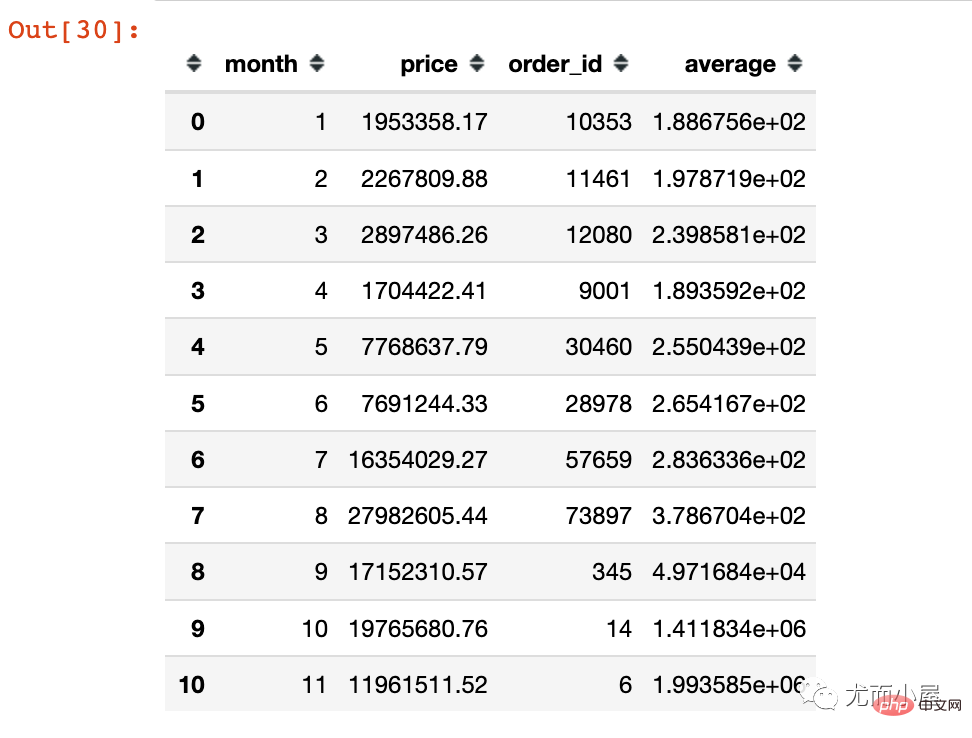
分析4:每月订单价多少?In [27]: amount_by_month# 每月成交金额 Out[27]:
In [29]: amount_by_userid = pd.merge(amount_by_month,order_by_month) amount_by_userid Out[29]:
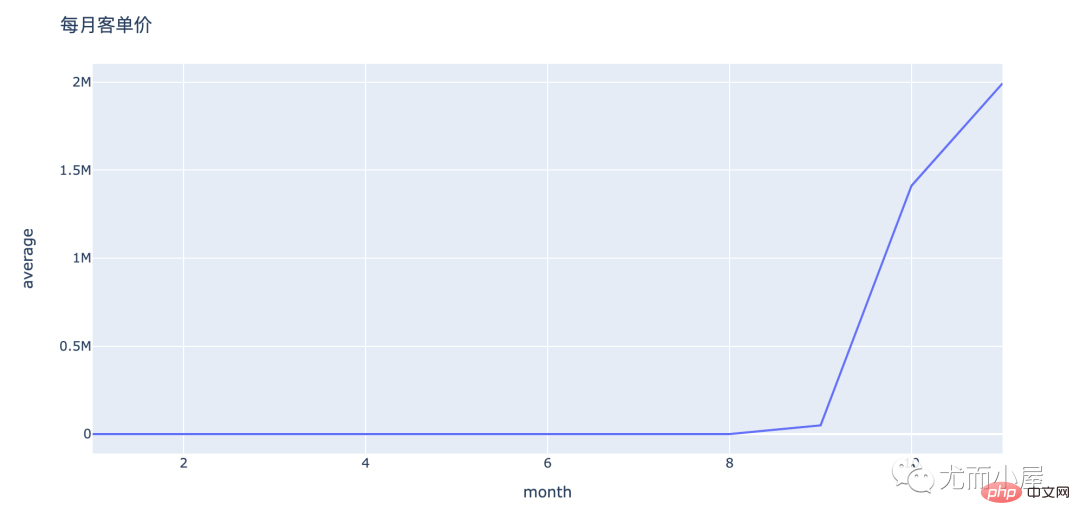
In [30]: amount_by_userid["average"] = amount_by_userid["price"] / amount_by_userid["order_id"] amount_by_userid
fig = px.line(amount_by_userid,x="month",y="average")

fig.update_layout(height=500, width=1000, title_text="每月客单价")

fig.show()
从上面的折线图可以看出来:
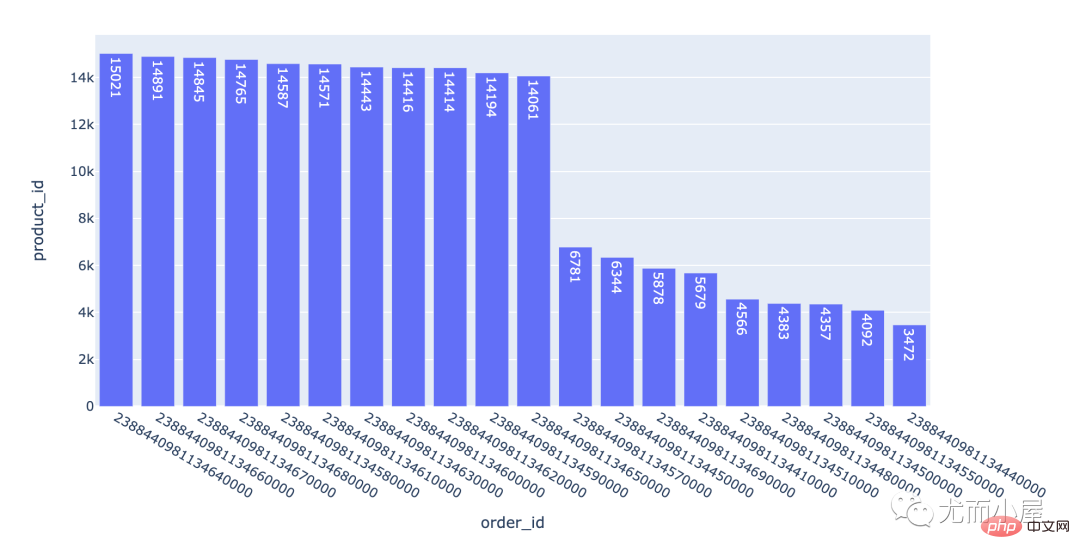
分析5:每个订单包含多少产品In [32]: product_by_order = df.groupby("order_id")["product_id"].count().reset_index().sort_values("product_id",ascending=False)
product_by_order.head(10)Out[32]:
In [35]: df1 = local.sort_values("order_id",ascending=True)# 订单量升序
df1Out[35]:
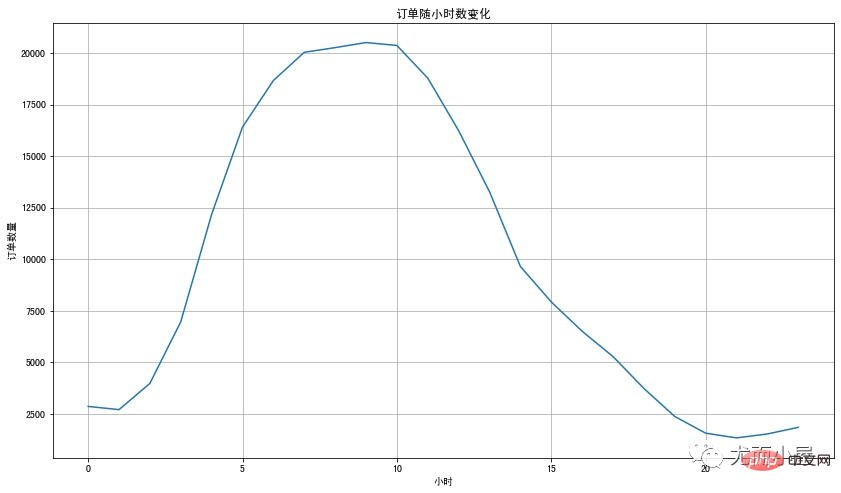
In [47]: plt.figure(figsize=(14,8))
df3["order_id"].plot()
plt.xlabel('小时')
plt.ylabel('订单数量')
plt.title('订单随小时数变化')
plt.grid()
plt.show()
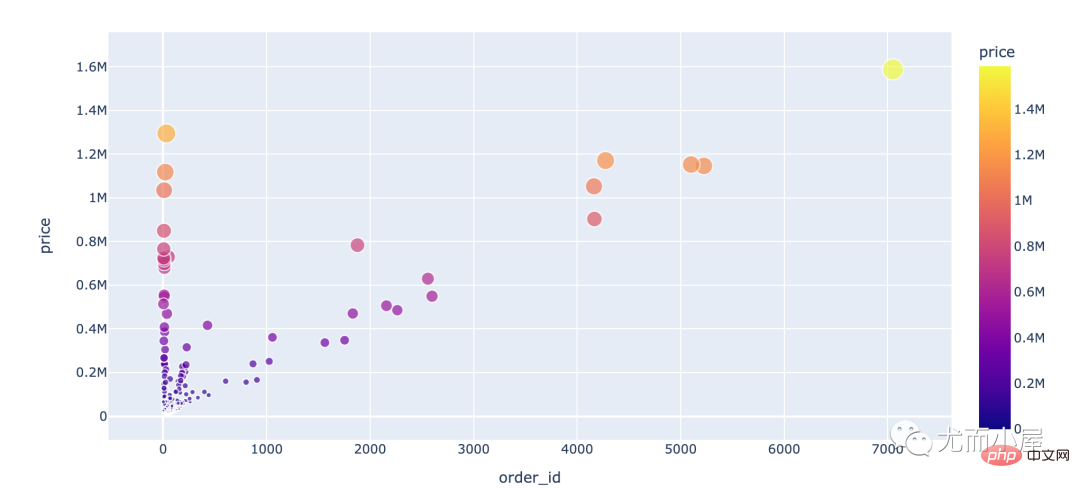
用户都喜欢在上午8、9、10点下单;可能是刚开始上班工作,大家更积极 不同用户消费行为分析分析10:消费次数和消费金额In [48]: df4 = df.groupby("user_id").agg({"order_id":"nunique", "price":sum})
fig = px.scatter(df4,
x="order_id",
y="price",
color="price",
size="price")
fig.show()
分析11:用户消费周期In [50]: # 用户消费周期
# shift函数:移动一个单位
purchase_time=df.groupby('user_id').apply(lambda x: x['event_time'] - x['event_time'].shift()).dt.days
purchase_timeOut[50]: user_id 151591562543995000096014NaN 1515915625440030000374760 NaN 48492735.0 1515915625440050000463812 NaN 473430 1.0 ... 1515915625514880000564132 0.0 564143 0.0 564164 0.0 1515915625514890000564158 NaN 564165 0.0 Name: event_time, Length: 564130, dtype: float64 In [51]: purchase_time[purchase_time>0].describe() Out[51]: count120629.000000 mean 35.494500 std 663.803583 min 1.000000 25% 2.000000 50% 4.000000 75%12.000000 max 18466.000000 Name: event_time, dtype: float64 说明:
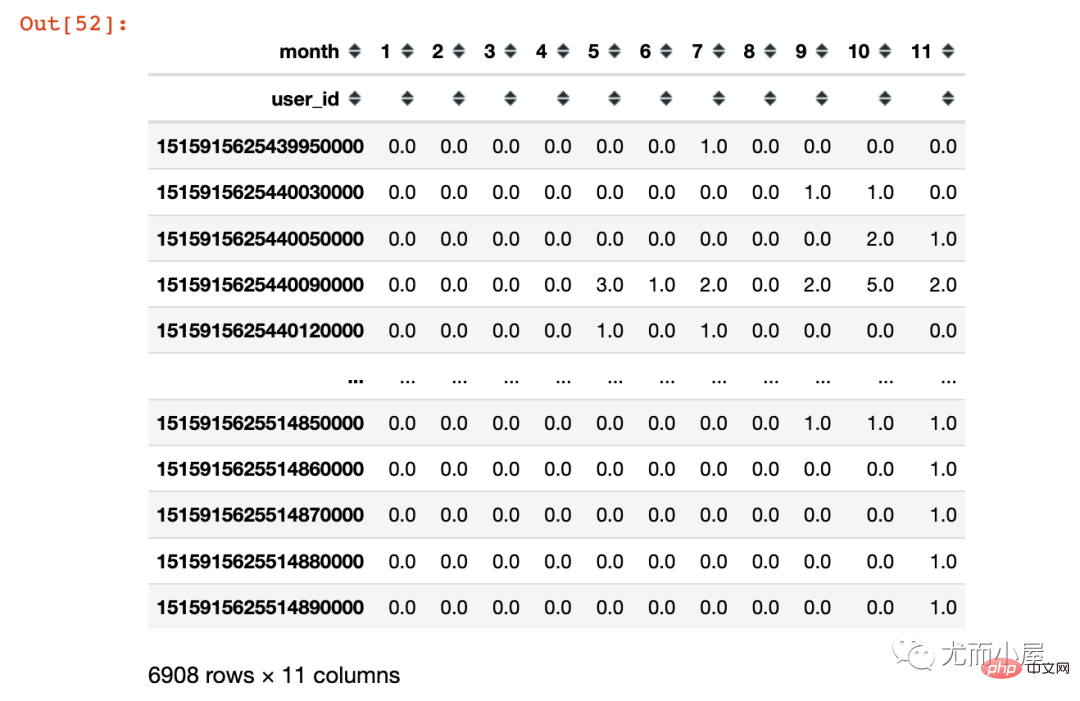
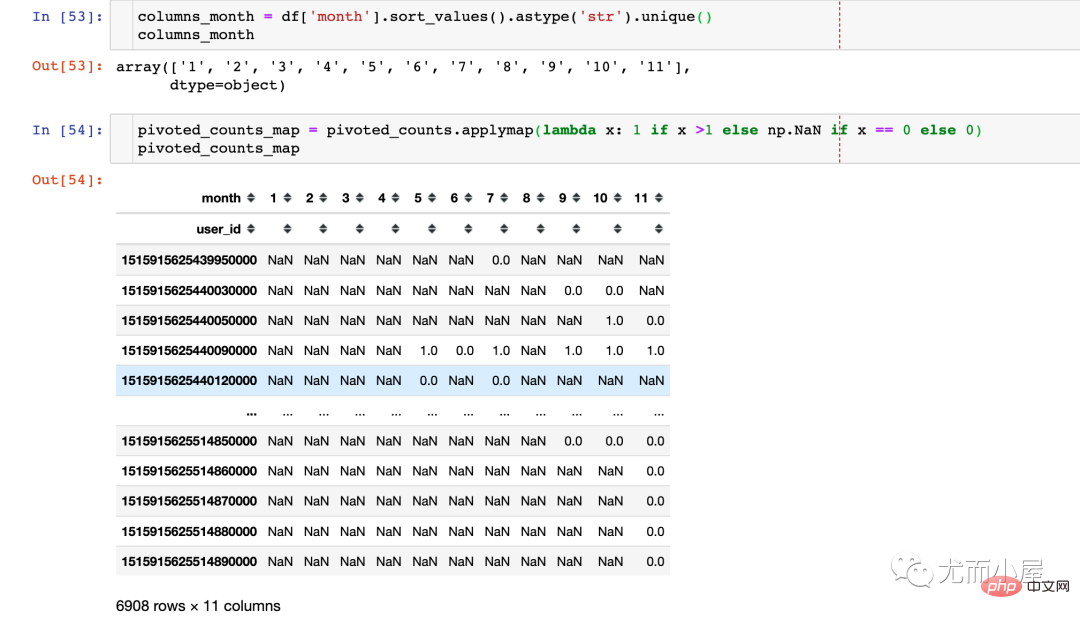
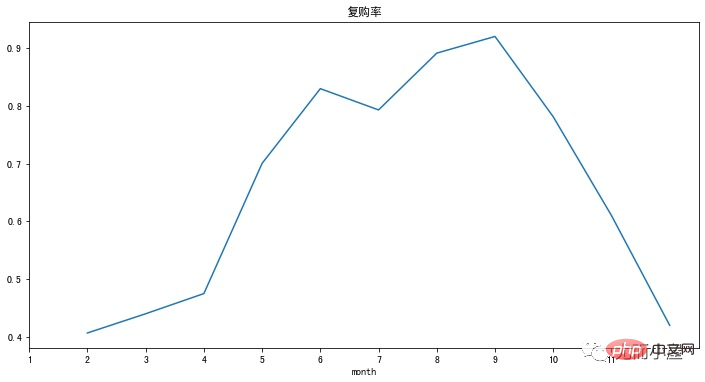
分析12:用户复购行为In [52]: pivoted_counts = df.pivot_table(index='user_id', columns='month', values='order_id', aggfunc='nunique').fillna(0) pivoted_counts Out[52]:
pivoted_counts_map.sum() / pivoted_counts_map.count()

# 结果
month
1 0.406340
2 0.439655
3 0.474640
4 0.700328
5 0.829861
6 0.792990
7 0.891452
8 0.920328
9 0.781153
100.609963
110.419592
dtype: float64
(pivoted_counts_map.sum()/pivoted_counts_map.count()).plot(figsize=(12,6))
plt.xticks(range(11),columns_month)
plt.title('复购率')
plt.show()
|
Atas ialah kandungan terperinci Perlombongan data e-dagang berdasarkan pembelajaran mesin |. Untuk maklumat lanjut, sila ikut artikel berkaitan lain di laman web China PHP!
Artikel berkaitan
Lihat lagi- Aliran teknologi untuk ditonton pada tahun 2023
- Cara Kecerdasan Buatan Membawa Kerja Baharu Setiap Hari kepada Pasukan Pusat Data
- Bolehkah kecerdasan buatan atau automasi menyelesaikan masalah kecekapan tenaga yang rendah dalam bangunan?
- Pengasas bersama OpenAI ditemu bual oleh Huang Renxun: Keupayaan penaakulan GPT-4 belum mencapai jangkaan
- Bing Microsoft mengatasi Google dalam trafik carian terima kasih kepada teknologi OpenAI


