
Rumah >hujung hadapan web >tutorial js >plotly.js 绘图库入门教程分享
plotly.js 绘图库入门教程分享

- 小云云asal
- 2018-02-24 09:01:042696semak imbas
本文主要和大家介绍了详解plotly.js 绘图库入门使用教程,小编觉得挺不错的,现在分享给大家,也给大家做个参考。一起跟随小编过来看看吧,希望能帮助到大家。
Plotly
缘起
这两天想在前端展现数学函数图像,猜测应该有成熟的 js 库。
于是,简单的进行了尝试。
最后决定使用plotly.js,其他的比如function-plot 看起来也不错,以后有时间再看。
Plotly
plotly.js is the open source JavaScript graphing library that powers Plotly.
Plotly 可以称之为迄今最优秀的绘图库,没有之一。
简单案例
代码
<!DOCTYPE html>
<html>
<head>
<meta charset="UTF-8">
<title>plot 绘制图像</title>
</head>
<body>
<p id="tester" style="width:600px;height:250px;"></p>
</body>
<script src="https://cdn.plot.ly/plotly-1.2.0.min.js"></script>
<!-- test -->
<script>
TESTER = document.getElementById('tester');
Plotly.plot(TESTER, [{
x: [1, 2, 3, 4, 5],
y: [1, 2, 4, 8, 16]
}], {
margin: {t: 0}
});
</script>
</html>效果
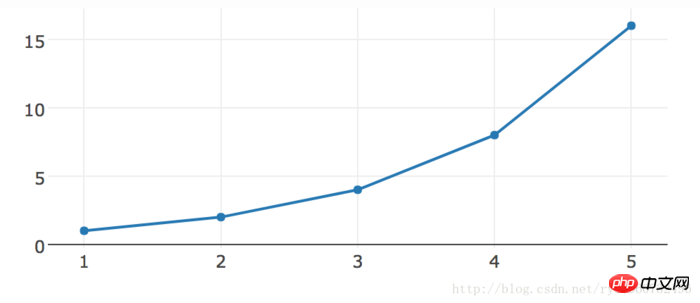
点图
绘制数学图像
数学图像绘图的原理。比如说 y = 2*x+1,实际上就是一系列 (x,y) 的点连接而成的图像。
代码
<p id="math-function" style="width:600px;height:250px;"></p>
<script src="https://cdn.plot.ly/plotly-1.2.0.min.js"></script>
<script>
TESTER = document.getElementById('math-function');
var x = [], y = [];
for(var i = -10; i < 10; i += 1) {
x.push(i);
y.push(2*i+1);
}
Plotly.plot(TESTER, [{
x: x,
y: y
}], {
margin: {t: 0}
});
</script>效果
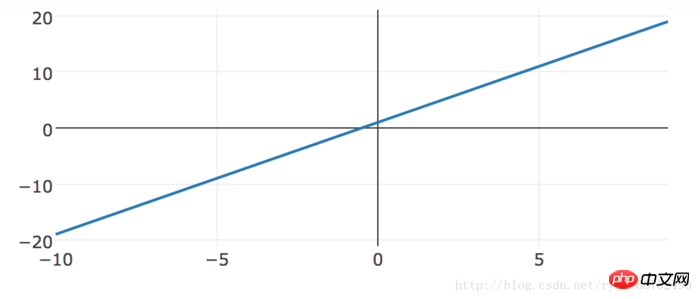
函数图像
相关推荐:
分享Python如何利用plotly绘制数据图表的案例(图文)
Atas ialah kandungan terperinci plotly.js 绘图库入门教程分享. Untuk maklumat lanjut, sila ikut artikel berkaitan lain di laman web China PHP!
Kenyataan:
Kandungan artikel ini disumbangkan secara sukarela oleh netizen, dan hak cipta adalah milik pengarang asal. Laman web ini tidak memikul tanggungjawab undang-undang yang sepadan. Jika anda menemui sebarang kandungan yang disyaki plagiarisme atau pelanggaran, sila hubungi admin@php.cn
Artikel sebelumnya:JavaScript构造器详解Artikel seterusnya:子组件调用父组件的方法实例
Artikel berkaitan
Lihat lagi- Analisis mendalam bagi komponen kumpulan senarai Bootstrap
- Penjelasan terperinci tentang fungsi JavaScript kari
- Contoh lengkap penjanaan kata laluan JS dan pengesanan kekuatan (dengan muat turun kod sumber demo)
- Angularjs menyepadukan UI WeChat (weui)
- Cara cepat bertukar antara Cina Tradisional dan Cina Ringkas dengan JavaScript dan helah untuk tapak web menyokong pertukaran antara kemahiran_javascript Cina Ringkas dan Tradisional