Rumah >hujung hadapan web >tutorial js >用Vue.js 和 Chart.js如何制作很炫的图表
用Vue.js 和 Chart.js如何制作很炫的图表
- 巴扎黑asal
- 2017-04-15 09:05:323024semak imbas

深入学习 chart.js 的选项来制作漂亮的图表。交互式图表可以给你的数据可视化提供很酷的展示方式。但是大多数开箱即用的解决方案用默认的选项并不能做出很绚丽的图表。
这篇文章中,我会教你如何自定义 chart.js 选项来制作很酷的图表。
⚡ Quick Start
我们需要:
Vue.js
vue-chart.js
vue-cli
使用 vue-cli 来搭基本架构,希望你已经安装好了。我们使用 vue-chart.js 来作为 chart.js 的打包器。
vue init webpack awesome-charts
然后到工程目录中安装依赖:
cd awesome-charts && yarn install
添加 vue-chartjs:
yarn add vue-chartjs -S
第一个图表
现在我们来创建第一个折现表。
touch src/components/LineChart.js && subl .
现在需要从 vue-chartjs 中引入折线表的基表,创建组件。
在 mount() 函数中使用我们准备好的数据和选项来调用 renderChart()方法。
    import {Line} from 'vue-chartjs'

    export default Line.extend({
      mounted () {

        this.renderChart({
          labels: ['January', 'February', 'March', 'April', 'May', 'June', 'July'],
          datasets: [
            {
              label: 'Data One',
              backgroundColor: '#FC2525',
              data: [40, 39, 10, 40, 39, 80, 40]
            },{
              label: 'Data Two',
              backgroundColor: '#05CBE1',
              data: [60, 55, 32, 10, 2, 12, 53]
            }
          ]
        }, {responsive: true, maintainAspectRatio: false})

      }
    })
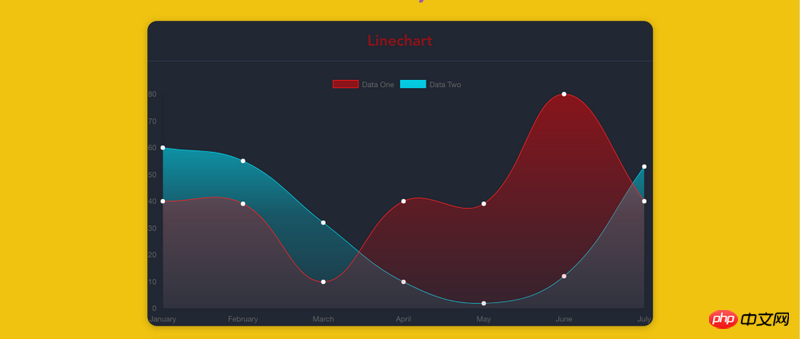
代码中,使用了一些实例数据和可选参数传递给 chart.js 的数据对象,并且设置 responsive:true,使得图表会充满外层容器。
之所以可以使用 renderChart() 方法是因为我们继承了 BaseChart,这个方法和一些属性都是在 BaseChart 中定义的。
运行 & 测试
ok,现在从 App.vue 中把 Hello.vue 删掉,并且引入我们的图表:
    <template>
      <p id="app">
        <p class="container">
          <p class="Chart__list">
            <p class="Chart">
              <h2>Linechart</h2>
              <line-example></line-example>
            </p>
          </p>
        </p>
      </p>
    </template>

    <script>
    import LineExample from './components/LineChart.js'
    export default {
      name: 'app',
      components: {
        LineExample
      }
    }
    </script>

    <style>
    #app {
      font-family: 'Avenir', Helvetica, Arial, sans-serif;
      -webkit-font-smoothing: antialiased;
      -moz-osx-font-smoothing: grayscale;
      text-align: center;
      color: #2c3e50;
      margin-top: 60px;
    }
    .container {
      max-width: 800px;
      margin:  0 auto;
    }
    </style>
    CopyRaw
在终端中运行 dev 脚本,就可以看到图表了。
yarn run dev
把我变得更漂亮
现在该做些美化工作了
Atas ialah kandungan terperinci 用Vue.js 和 Chart.js如何制作很炫的图表. Untuk maklumat lanjut, sila ikut artikel berkaitan lain di laman web China PHP!
Artikel berkaitan
Lihat lagi- Analisis mendalam bagi komponen kumpulan senarai Bootstrap
- Penjelasan terperinci tentang fungsi JavaScript kari
- Contoh lengkap penjanaan kata laluan JS dan pengesanan kekuatan (dengan muat turun kod sumber demo)
- Angularjs menyepadukan UI WeChat (weui)
- Cara cepat bertukar antara Cina Tradisional dan Cina Ringkas dengan JavaScript dan helah untuk tapak web menyokong pertukaran antara kemahiran_javascript Cina Ringkas dan Tradisional

