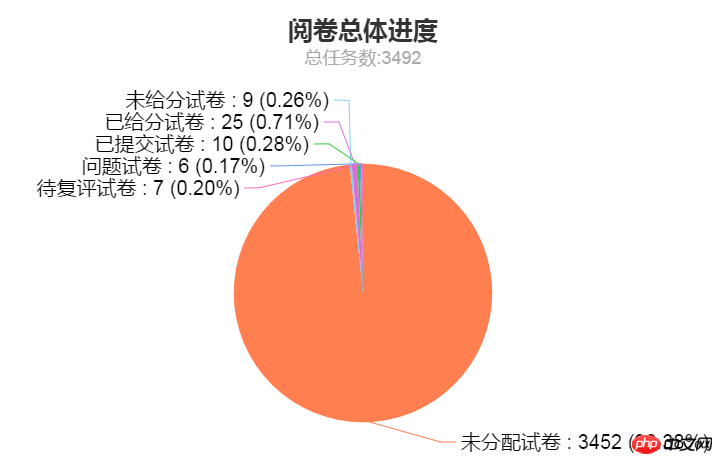
我打算用 python+selenium 实现对下图中各个数值的捕获。可是现在一头雾水,不知如何能定位到目标元素。
谁给帮帮忙给点建议。
 <p id="chart" class="echarts_pie" _echarts_instance_="1487904212096" style="-webkit-tap-highlight-color: transparent; user-select: none; background-color: rgba(0, 0, 0, 0); cursor: default;">
    <p style="position: relative; overflow: hidden; width: 782px; height: 470px;">
        <p data-zr-dom-id="bg" class="zr-element" style="position: absolute; left: 0px; top: 0px; width: 782px; height: 470px; user-select: none;"></p>
        <canvas width="782" height="470" data-zr-dom-id="0" class="zr-element" style="position: absolute; left: 0px; top: 0px; width: 782px; height: 470px; user-select: none; -webkit-tap-highlight-color: rgba(0, 0, 0, 0);"></canvas>
        <canvas width="782" height="470" data-zr-dom-id="1" class="zr-element" style="position: absolute; left: 0px; top: 0px; width: 782px; height: 470px; user-select: none; -webkit-tap-highlight-color: rgba(0, 0, 0, 0);"></canvas>
        <canvas width="782" height="470" data-zr-dom-id="_zrender_hover_" class="zr-element" style="position: absolute; left: 0px; top: 0px; width: 782px; height: 470px; user-select: none; -webkit-tap-highlight-color: rgba(0, 0, 0, 0);"></canvas>
    </p>
 </p>