Python-matplotlib | 이중 y축 그래픽 그리기(범례 설정)
- Python当打之年앞으로
- 2023-08-09 16:06:302852검색
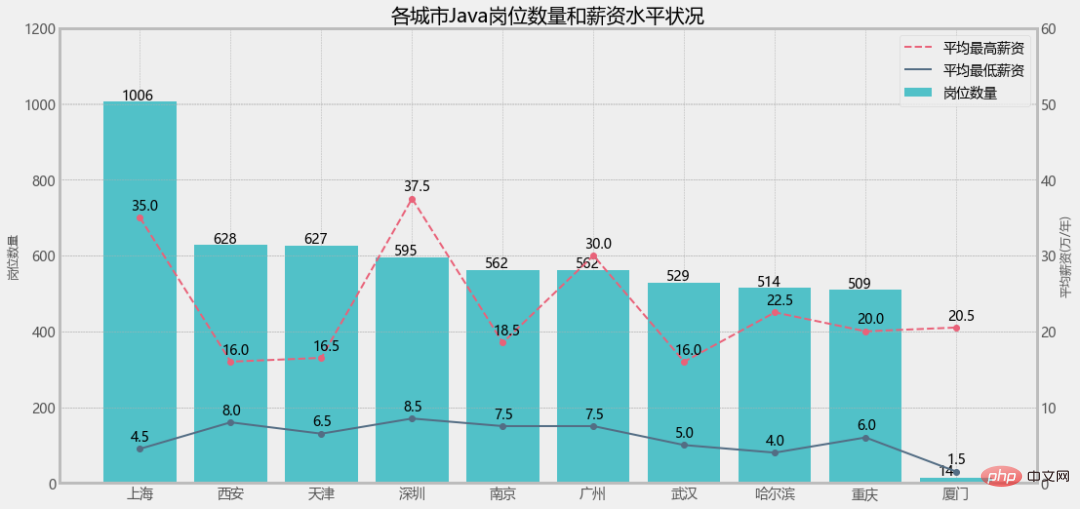
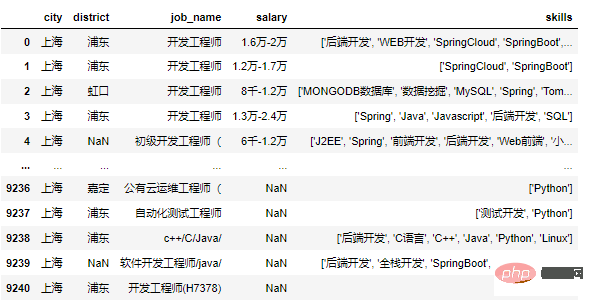
df = pd.read_csv('jobdata.csv')
1. 직급 꺾은선형 차트
colors = ["#51C1C8", "#536D84","#E96279"]
plt.figure(figsize=(16, 8))
ax1 = plt.subplot(111)
ax1.set_ylim(0,1200)
lin0 = ax1.plot(x_data, y_data1, marker='o', color=colors[0], label='岗位数量')
for x, y in enumerate(y_data1):
    plt.text(x - 0.2, y+5, y)
ax1.set_ylabel('岗位数量',fontsize=12)
plt.legend()
plt.title("各城市Java岗位数量")
plt.show()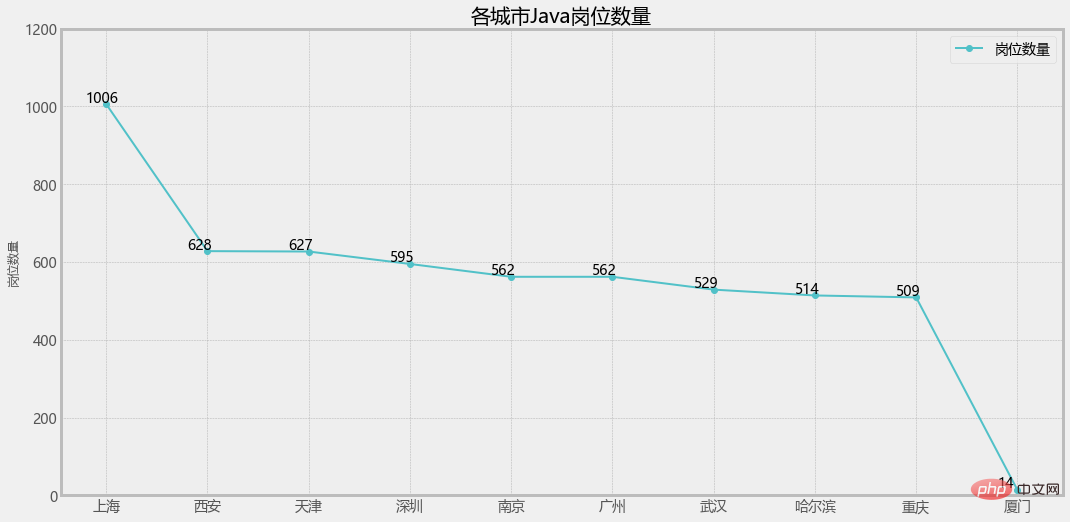
2.ax1.twinx(를 통해 y축을 추가합니다. ):
# 增加y轴
ax2 = ax1.twinx()

ax2.set_ylim(0,60)
lin1 = ax2.plot(x_data, y_data2, linestyle='--', marker='o', c=colors[1], label='平均最低薪资')
for x, y in enumerate(y_data2):
    plt.text(x - 0.1, y+1, y)
lin2 = ax2.plot(x_data, y_data3, linestyle='--', marker='o', c=colors[2], label='平均最高薪资')
for x, y in enumerate(y_data3):
    plt.text(x - 0.1, y+1, y)
ax2.set_ylabel('平均薪资(万/年)',fontsize=12)
plt.legend()
plt.title("各城市Java岗位数量和薪资水平状况")
plt.show()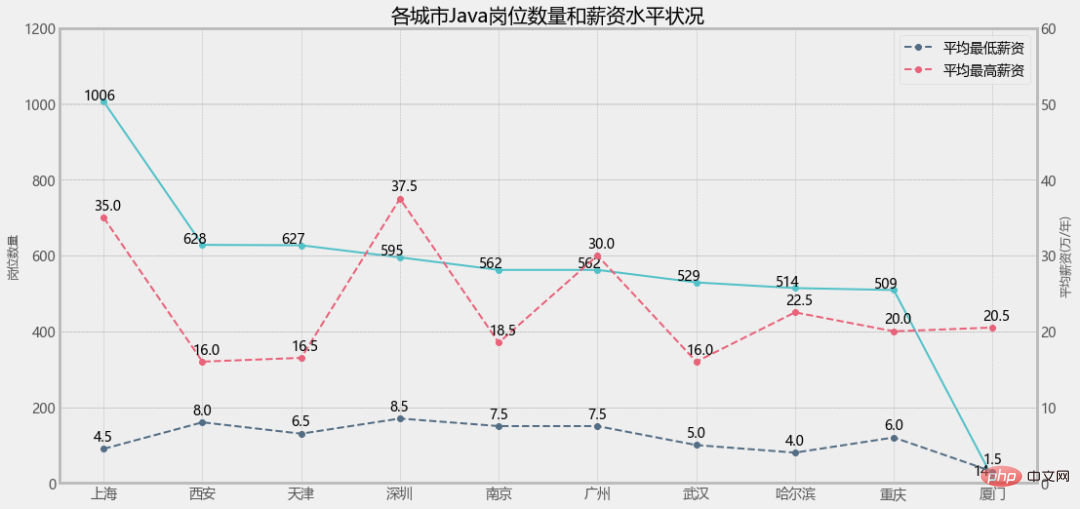
3. 单独设置图例
ax1.legend(loc='best')
ax2.legend(loc='best')
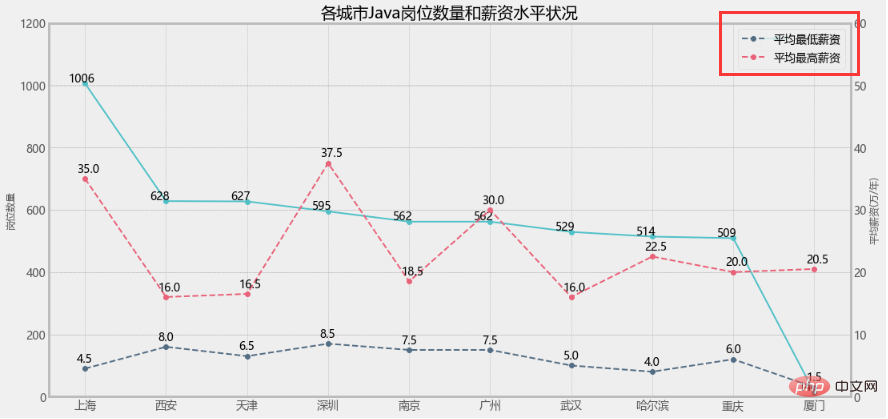
ax1.legend(loc=2)
ax2.legend(loc=1)
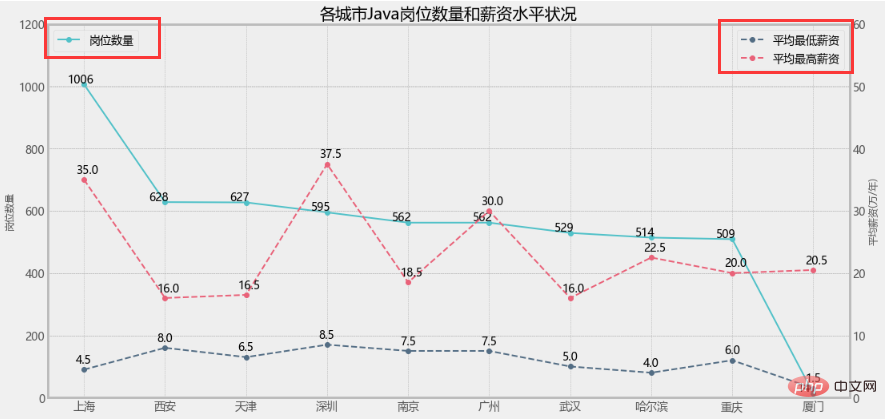
这样看就比较直观了,但是我就想把三个图例放一起不可以吗?
当然可以!
3. 设置组合图例
lines = lin0+lin1+lin2
labs = [label.get_label() for label in lines]
plt.legend(lines,labs)
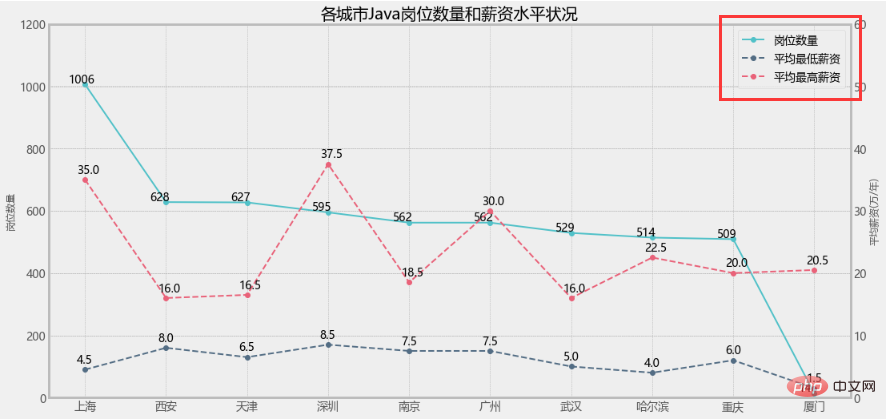
大功告成!
但是!如果是柱状图+折线图的情况,效果还一样吗?
但是!如果是柱状图+折线图的情况,效果还一样吗?
但是!如果是柱状图+折线图的情况,效果还一样吗?
1. 修改岗位数量为柱状图
plt.figure(figsize=(16, 8))
a1 = plt.subplot(111)
a1.set_ylim(0,1200)
bar = a1.bar(x_data, y_data1, color=colors[0], label='岗位数量')
for x, y in enumerate(y_data1):
    plt.text(x - 0.2, y+5, y)
a1.set_ylabel('岗位数量',fontsize=12)

...

lines = bar+lin1+lin2
labs = [label.get_label() for label in lines]
plt.legend(lines,labs)
直接报错了!


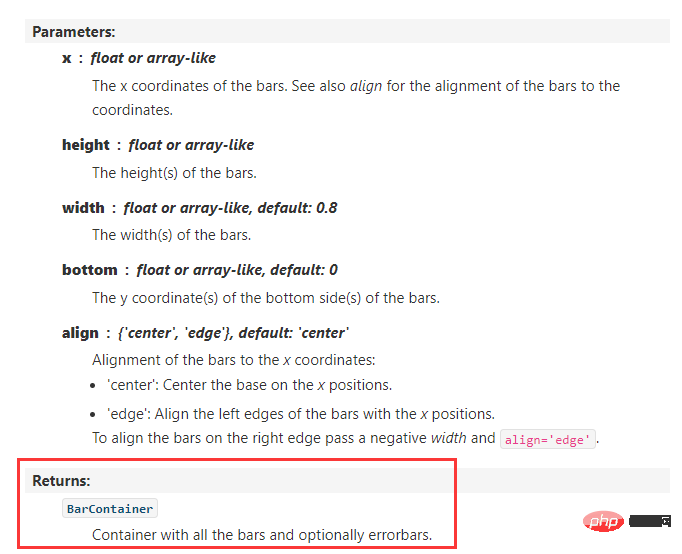
프롬프트 유형이 일치하지 않습니다. 이는 막대 및 선 유형에 문제가 있는 것입니다. 소스 코드를 확인해 보겠습니다.
matplotlib.axes.Axes.plot:
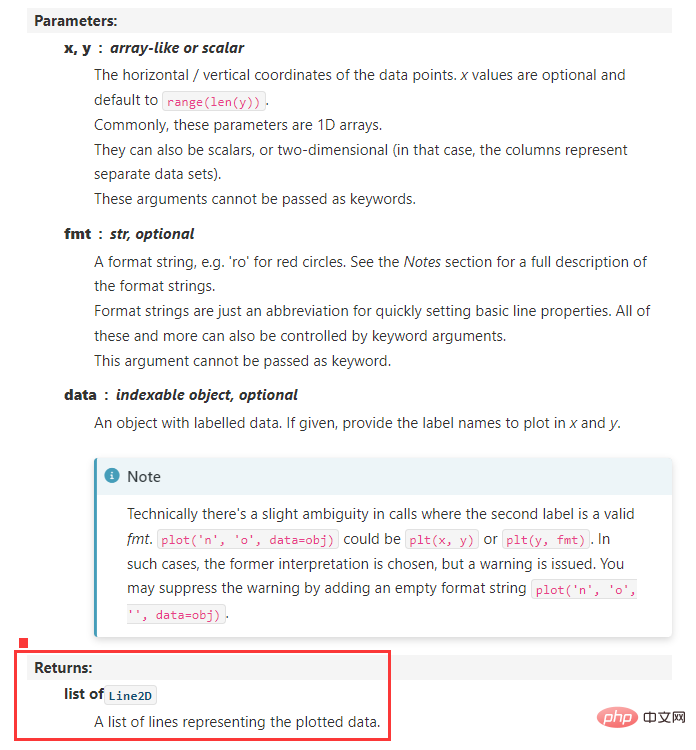
matplotlib.axes. Axes.bar:
2. 设置Line2D和patches的组合图例
legend_handles = [
    Line2D([], [], linewidth=1, ls='--', lw=2, c=colors[2], label='平均最高薪资'),
    Line2D([], [], linewidth=1, lw=2, c=colors[1], label='平均最低薪资'),
    patches.Rectangle((0, 0), 1, 1, facecolor=colors[0],label='岗位数量')
]
plt.legend(handles=legend_handles, loc='best', fontsize=14)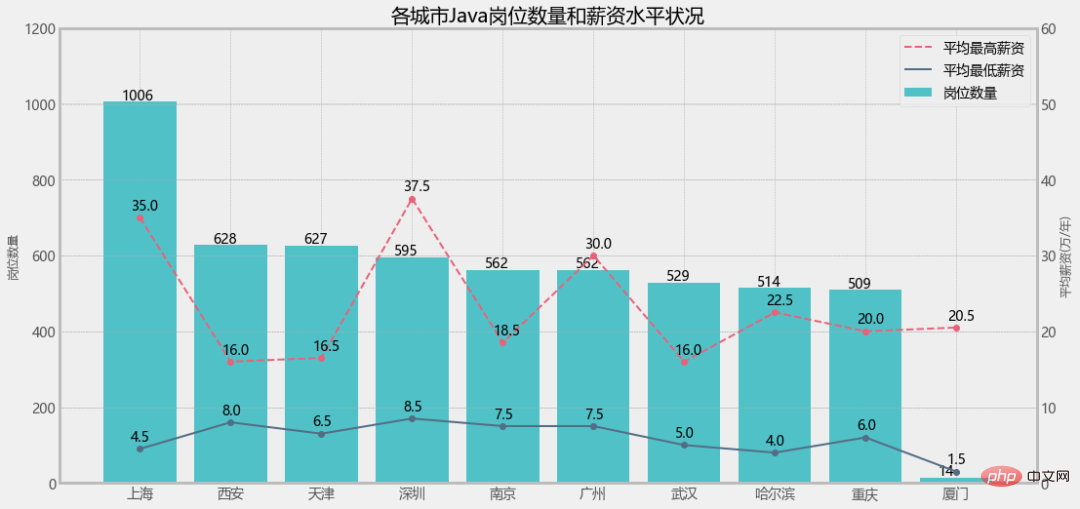
위 내용은 Python-matplotlib | 이중 y축 그래픽 그리기(범례 설정)의 상세 내용입니다. 자세한 내용은 PHP 중국어 웹사이트의 기타 관련 기사를 참조하세요!
성명:
이 기사는 Python当打之年에서 복제됩니다. 침해가 있는 경우 admin@php.cn으로 문의하시기 바랍니다. 삭제

