Python으로 흥미로운 시각화 차트를 그리는 방법
- PHPz앞으로
- 2023-04-18 16:25:051627검색
SchemDraw
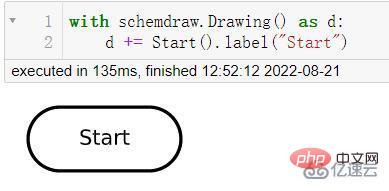
그래서 SchemDraw 모듈에는 흐름도의 주요 노드를 나타내는 데 사용되는 6개의 요소가 있습니다. 타원은 결정의 시작과 끝을 나타냅니다.
import schemdraw
from schemdraw.flow import *
with schemdraw.Drawing() as d:
 d += Start().label("Start")
output
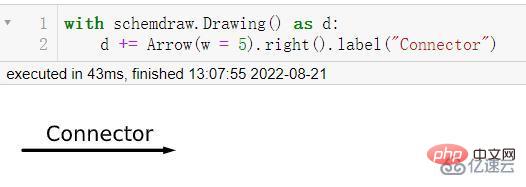
화살표는 의사결정 방향을 나타내며 다양한 노드를 연결하는 데 사용됩니다. 코드는 다음과 같습니다.
with schemdraw.Drawing() as d:
 d += Arrow(w = 5).right().label("Connector")
output
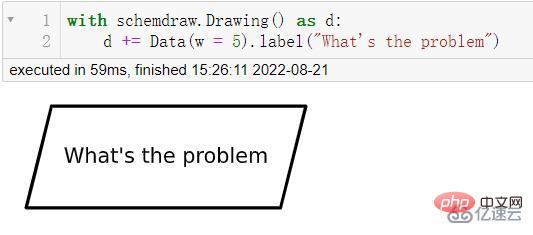
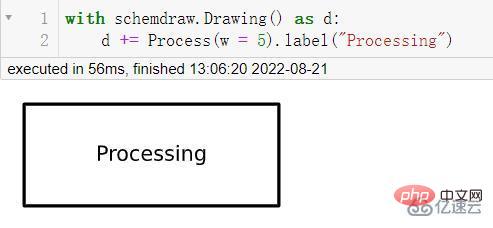
평행사변형은 처리하고 해결해야 하는 문제를 나타냅니다. 직사각형은 이를 위해 수행해야 하는 노력 또는 프로세스를 나타내며, 코드는 다음과 같습니다.
with schemdraw.Drawing() as d:
 d += Data(w = 5).label("What's the problem")
output
with schemdraw.Drawing() as d:
 d += Process(w = 5).label("Processing")
output
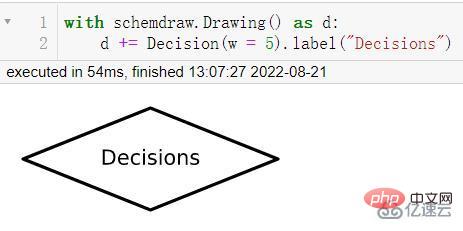
다이아몬드는 의사 결정의 구체적인 상황을 나타냅니다. 코드는 다음과 같습니다.
with schemdraw.Drawing() as d:
 d += Decision(w = 5).label("Decisions")
output
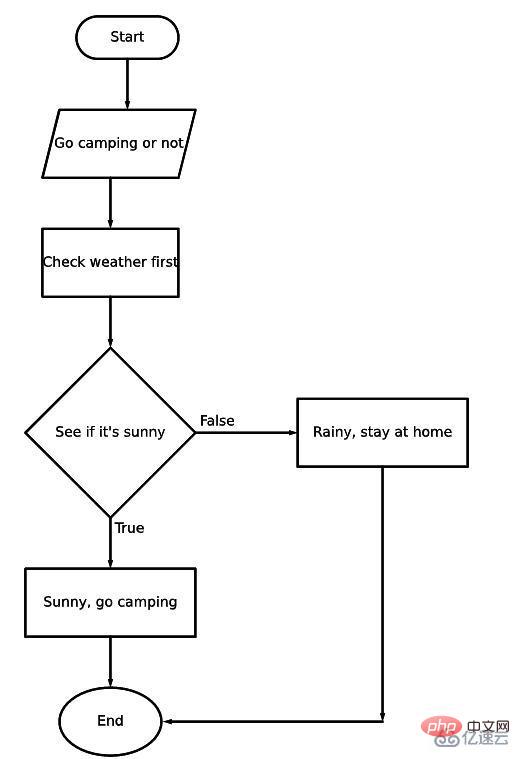
간단한 흐름도를 그려보겠습니다. 주말에 캠핑을 갈지 고민 중이라면, 캠핑을 가려면 날씨를 꼭 확인해야 합니다. 비가 오면 가지 마세요. 이 논리에 따라 코드는 다음과 같습니다.
import schemdraw
from schemdraw.flow import *
with schemdraw.Drawing() as d:
 d+= Start().label("Start")
 d+= Arrow().down(d.unit/2)
 # 具体是啥问题嘞
 d+= Data(w = 4).label("Go camping or not")
 d+= Arrow().down(d.unit/2)
 # 第一步 查看天气
 d+= Box(w = 4).label("Check weather first")
 d+= Arrow().down(d.unit/2)
 # 是否是晴天
 d+= (decision := Decision(w = 5, h= 5,
S = "True",
 E = "False").label("See if it's sunny"))
 # 如果是真的话
 d+= Arrow().length(d.unit/2)
 d+= (true := Box(w = 5).label("Sunny, go camping"))
 d+= Arrow().length(d.unit/2)
 # 结束
 d+= (end := Ellipse().label("End"))
 # 如果不是晴天的话
 d+= Arrow().right(d.unit).at(decision.E)
 # 那如果是下雨天的话,就不能去露营咯
 d+= (false := Box(w = 5).label("Rainy, stay at home"))
 # 决策的走向
 d+= Arrow().down(d.unit*2.5).at(false.S)
 # 决策的走向
 d+= Arrow().left(d.unit*2.15)
 d.save("palindrome flowchart.jpeg", dpi = 300)
output
import networkx as nx
import matplotlib.pyplot as plt
import numpy as np
G = nx.DiGraph()
nodes = np.arange(0, 8).tolist()
G.add_nodes_from(nodes)
# 节点连接的信息,哪些节点的是相连接的
G.add_edges_from([(0,1), (0,2),
(1,3), (1, 4),
(2, 5), (2, 6), (2,7)])
# 节点的位置
pos = {0:(10, 10),
1:(7.5, 7.5), 2:(12.5, 7.5),
3:(6, 6), 4:(9, 6),
5:(11, 6), 6:(14, 6), 7:(17, 6)}
# 节点的标记
labels = {0:"CEO",
 1: "Team A Lead",
 2: "Team B Lead",
 3: "Staff A",
 4: "Staff B",
 5: "Staff C",
 6: "Staff D",
 7: "Staff E"}
nx.draw_networkx(G, pos = pos, labels = labels, arrows = True,
node_shape = "s", node_color = "white")
plt.title("Company Structure")
plt.show()
output
nx.draw_networkx(G, pos = pos, labels = labels,
bbox = dict(facecolor = "skyblue",
boxstyle = "round", ec = "silver", pad = 0.3),
edge_color = "gray"
 )
plt.title("Company Structure")
plt.show()
output

위 내용은 Python으로 흥미로운 시각화 차트를 그리는 방법의 상세 내용입니다. 자세한 내용은 PHP 중국어 웹사이트의 기타 관련 기사를 참조하세요!
성명:
이 기사는 yisu.com에서 복제됩니다. 침해가 있는 경우 admin@php.cn으로 문의하시기 바랍니다. 삭제

