Python은 날씨 데이터와 시각적 분석을 크롤링합니다.
- 王林앞으로
- 2023-04-12 18:37:112379검색

Text
안녕하세요 여러분, 저는 파이썬 인공지능 기술입니다
우리는 매일 일기예보에 주의하겠습니다. 미래의 날씨, 일일 기온, 풍속 및 날씨에 따라 옷을 추가하거나 제거하고 여행을 준비할 수 있습니다. 방향, 상대 습도, 공기 질 관심의 중심이 될 때까지 기다리세요. 온도 및 습도 변화 곡선, 대기 질 지도, 풍향 레이더 지도 등의 결과를 얻어 미래 기상 정보를 얻는 효과적인 방법을 제공합니다.
1. 데이터 수집
웹사이트 링크 요청
먼저 중국 기상 네트워크 URL을 확인하세요: http://www.weather.com.cn/weather/101280701.shtml 원하는 경우 여기에서 현지 날씨 URL을 방문하세요. 크롤링 다른 지역에서는 마지막 101280701 지역 번호만 수정하면 됩니다. 앞에 있는 날씨는 7일 웹페이지를 나타내고, Weather1d는 현재 날짜를 나타내고, Weather15d는 다음 14일을 나타냅니다. 여기서는 주로 7일 및 14일 중국 기상 네트워크를 방문합니다. request.get() 메소드를 사용하여 웹페이지를 요청하면, 접속에 성공하면 웹페이지의 모든 문자열 텍스트를 얻게 됩니다. 요청하는 과정입니다.
def getHTMLtext(url):
"""请求获得网页内容"""
 try:
r = requests.get(url, timeout = 30)
r.raise_for_status()
r.encoding = r.apparent_encoding
print("成功访问")
return r.text
 except:
print("访问错误")
 return" "
유용한 정보 추출
여기서 BeautifulSoup 라이브러리를 사용하여 방금 얻은 문자열에서 데이터를 추출합니다. 먼저 웹 페이지를 확인하고 데이터를 얻는 데 필요한 태그를 찾습니다.

7일을 찾을 수 있습니다. div 태그의 데이터 정보와 id="7d", 날짜, 날씨, 온도, 풍도 및 기타 정보는 모두 ul 및 li 태그에 있으므로 BeautifulSoup을 사용하여 얻은 웹 페이지 텍스트 div 태그 ID를 검색할 수 있습니다. ="7d"라고 검색하고 ul, li 태그가 모두 포함되어 있는지 찾아 태그에서 해당 데이터 값을 추출하여 해당 목록에 저장합니다.
여기서 주의할 점은 날짜의 온도가 가장 높지 않은 경우도 있고, 데이터가 없는 상황은 판단하고 처리해야 한다는 점입니다. 또한 온도 뒤에 있는 섭씨 기호, 날짜 숫자 추출, 바람 수준 텍스트 추출 등 일부 데이터 저장 형식을 미리 처리해야 합니다. 이를 위해서는 문자 검색 및 문자열 분할 처리가 필요합니다.
def get_content(html):
"""处理得到有用信息保存数据文件"""
final = []# 初始化一个列表保存数据
bs = BeautifulSoup(html, "html.parser")# 创建BeautifulSoup对象
body = bs.body
data = body.find('div', {'id': '7d'})# 找到div标签且id = 7d
다음은 오늘의 데이터를 크롤링합니다
data2 = body.find_all('div',{'class':'left-div'})
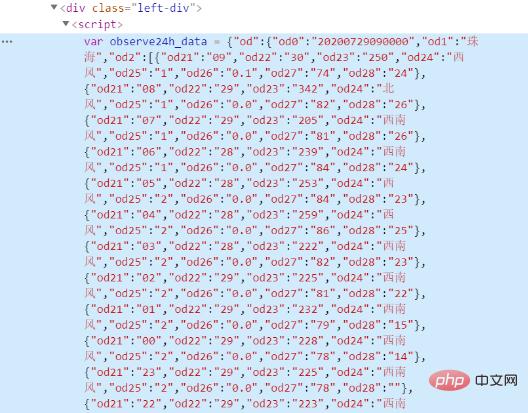
text = data2[2].find('script').string
text = text[text.index('=')+1 :-2] # 移除改var data=将其变为json数据
jd = json.loads(text)
dayone = jd['od']['od2'] # 找到当天的数据
final_day = [] # 存放当天的数据
count = 0
for i in dayone:
temp = []
if count <=23:
temp.append(i['od21']) # 添加时间
temp.append(i['od22']) # 添加当前时刻温度
temp.append(i['od24']) # 添加当前时刻风力方向
temp.append(i['od25']) # 添加当前时刻风级
temp.append(i['od26']) # 添加当前时刻降水量
temp.append(i['od27']) # 添加当前时刻相对湿度
temp.append(i['od28']) # 添加当前时刻控制质量
#print(temp)
final_day.append(temp)
count = count +1
다음은 7일 동안의 데이터를 크롤링합니다
ul = data.find('ul')# 找到所有的ul标签
li = ul.find_all('li')# 找到左右的li标签
i = 0 # 控制爬取的天数
for day in li:# 遍历找到的每一个li
if i < 7 and i > 0:
temp = []# 临时存放每天的数据
date = day.find('h1').string # 得到日期
date = date[0:date.index('日')] # 取出日期号
temp.append(date)
inf = day.find_all('p')# 找出li下面的p标签,提取第一个p标签的值,即天气
temp.append(inf[0].string)
 tem_low = inf[1].find('i').string # 找到最低气温
 if inf[1].find('span') is None: # 天气预报可能没有最高气温
 tem_high = None
 else:
 tem_high = inf[1].find('span').string# 找到最高气温
 temp.append(tem_low[:-1])
 if tem_high[-1] == '℃':
temp.append(tem_high[:-1])
 else:
temp.append(tem_high)
 wind = inf[2].find_all('span')# 找到风向
 for j in wind:
temp.append(j['title'])
 wind_scale = inf[2].find('i').string # 找到风级
 index1 = wind_scale.index('级')
 temp.append(int(wind_scale[index1-1:index1]))
 final.append(temp)
i = i + 1
return final_day,final
/weather15d에도 동일한 프로세스가 수행됩니다. 여기를 확인해보니 15일 동안의 정보가 있는 것으로 나타났습니다. 8~14일만, 처음 1~7일은 /weather에 있습니다. 여기서는 각각 두 개의 웹 페이지를 방문하고 크롤링된 데이터를 병합하여 마지막 14일의 데이터를 얻습니다. - 앞선 것은 앞으로 14일간의 데이터 크롤링 과정인데, 오늘의 24시간 기상정보 데이터에 대해서는 검색 결과 json 데이터임을 알 수 있습니다. .loads() 메서드를 사용하여 그날의 날씨 정보를 추출합니다.
csv 파일 저장
앞서 목록에 크롤링된 데이터를 추가하고, 여기에 csv 라이브러리를 도입하고, f_csv.writerow(header) 및 f_csv.writerows(data) 메서드를 사용하여 헤더와 각 행을 각각 씁니다. 1일과 향후 14일의 데이터는 각각 Weather1.csv와 Weather14.csv로 저장됩니다. 그들이 저장한 테이블은 다음과 같습니다.
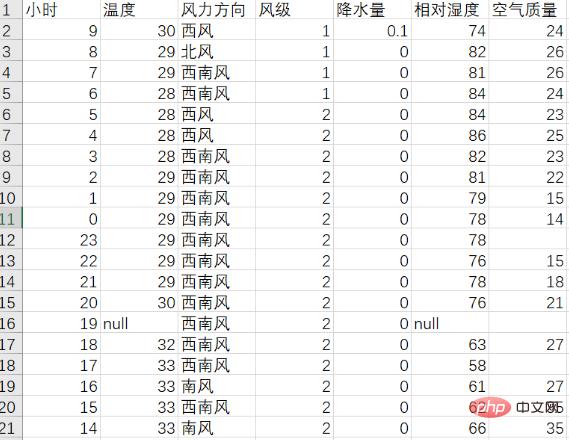
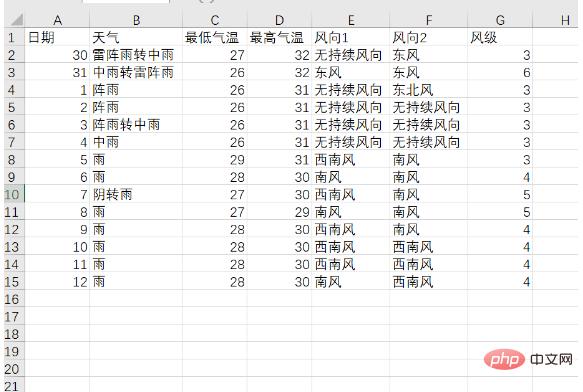
2. 온도 변화 곡선
matplotlib의 plt.plot() 메서드를 사용하여 하루 24시간 동안의 온도 변화 곡선을 그리고 plt.text() 메서드를 사용하여 최고 기온과 최저 기온을 지적하고 평균 기온을 그립니다. 아래 그림은 온도 변화 곡선 그래프를 보여줍니다. (코드는 부록을 참조하세요)
멋져요! 개인 작업에 꼭 필요한 N 오픈소스 프로젝트! 서둘러 모아보세요
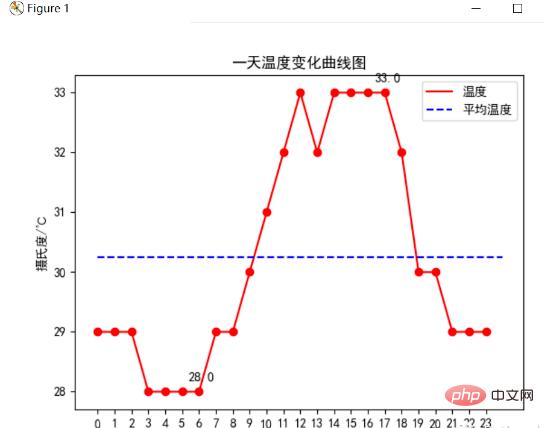 분석 결과 이날 최고기온은 33℃, 최저기온은 28℃, 평균기온은 20.4℃ 안팎인 것으로 분석됐다. 낮과 밤의 차이는 5℃로 이른 아침에는 저온이 분포하고 정오부터 오후에는 고온이 분포합니다.
오늘의 상대습도 변화 곡선
matplotlib의 plt.plot() 메소드를 사용하여 하루 24시간 동안의 습도 변화 곡선을 그리고, 평균 상대습도 선을 그리면 다음 그림이 습도 변화 곡선입니다. 코드는 부록을 참조하세요)
분석 결과 이날 최고 상대습도는 86%, 최저 상대습도는 58°C, 평균 상대습도는 75% 내외로 시간분석을 통해 이른 아침의 습도가 상대적으로 높은 것으로 나타났습니다. 오후부터 황혼까지의 습도는 낮습니다.
온도와 습도 상관 분석 차트
앞의 두 그림의 분석을 통해 온도와 습도 사이에 관계가 있음을 알 수 있습니다. 이 관계를 보다 명확하고 직관적으로 느끼려면 plt.scatter()를 사용하십시오. 온도를 가로좌표로, 습도를 세로좌표로 나누어 그래프에 각 순간의 점을 표시하고, 상관계수를 계산한 결과 그래프는 다음과 같습니다.
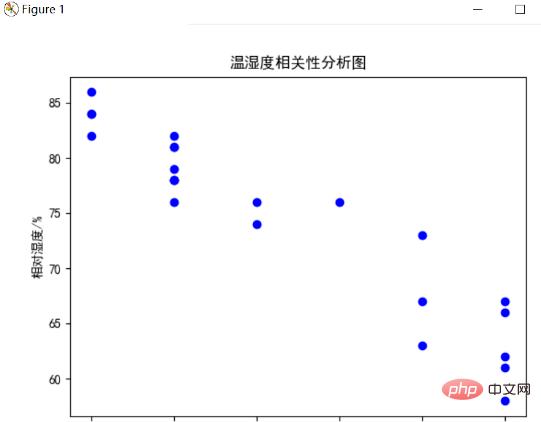
분석할 수 있습니다. 하루의 온도와 습도는 강한 상관관계가 있다는 것을 발견했습니다. 이는 시간과 음의 상관관계가 있음을 의미하며, 추가 분석에 따르면 온도가 낮을수록 공기 중 수분이 더 많아지고, 자연적으로 습도가 높아지며, 온도가 높아지면 수분이 증발하고 공기가 건조해지며, 이는 정상적인 기후 현상과 일치합니다.
대기질 지수 막대형 차트
대기질 지수 AQI는 대기질 상태를 정량적으로 나타내는 지수로, 값이 클수록 대기오염이 심하고 인체 건강에 미치는 해로움이 커집니다. 공기질 지수는 일반적으로 6단계로 구분되며, 수준이 높을수록 오염도가 심각한 것을 의미합니다. 다음은 plt.bar 방식을 사용하여 하루 24시간 동안의 공기질을 히스토그램으로 나타낸 것입니다. , 해당 히스토그램 색상도 밝은 부분에서 어두운 부분으로 변하며 이는 오염도가 점차 증가하고 있음을 나타내므로 오염 상황을보다 직관적으로 표시하며 최고 및 최저 대기 질 지수도 표시되며 평균 대기 질 지수는 다음과 같습니다. 아래 그림은 그 결과입니다. :
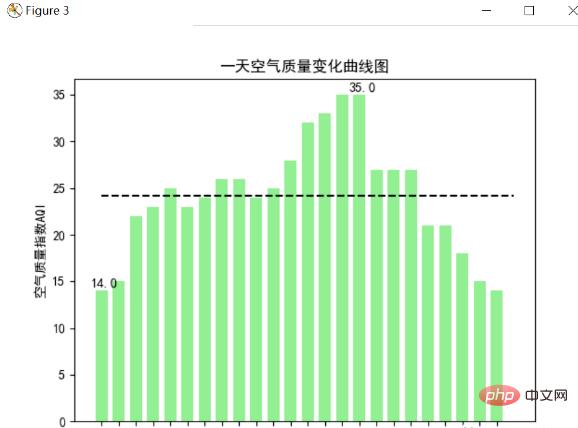
위는 남부 주하이의 대기 질 지수가 가장 높은 범위에 있음을 알 수 있습니다. 분석 결과 이날 공기질 지수가 가장 높은 것이 35에 달했고, 가장 낮은 것은 14에 불과했고 평균은 25 정도였다. 시간에 따라 공기 상태도 알 수 있다. 기본적으로 이른 아침(4~9시)에 가장 좋고, 가장 심각한 대기 오염은 오후에 발생하므로 일반적으로 오염이 최소화되는 이른 아침에 밖에 나가서 신선한 공기를 마실 수 있습니다.
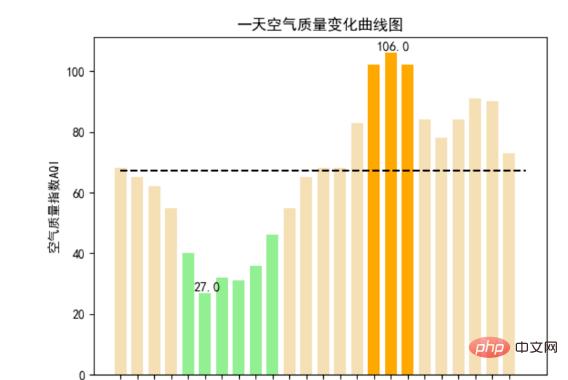
아래 대기질 지도는 북부 도시의 대기질 지도입니다. 이곳의 환경은 주하이에 비해 훨씬 열등하다는 것을 알 수 있습니다.
풍향 및 풍속 레이더 차트
하루 동안의 풍력 및 풍향 통계 풍력 및 풍향은 극좌표를 사용하여 표시하는 것이 더 좋으므로 극좌표 방식을 사용하여 풍력을 표시합니다. 그리고 그날의 풍향 차트를 원으로 나누어 8부분으로 나누어 각 부분은 풍향을 나타내고, 반경은 풍향이 높아질수록 파란색이 짙어집니다.
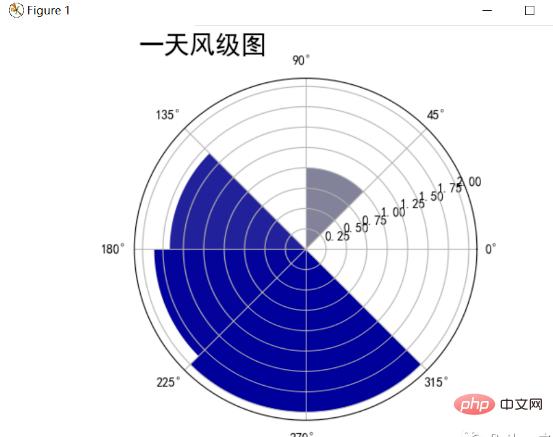
분석 결과 이날 남서풍이 가장 많이 부는 것으로 나타났으며, 평균 풍속은 1.75레벨에 이르렀으며, 일부 북동풍은 1.0레벨에 도달했고, 그 외 다른 곳에서는 바람이 불지 않았습니다. 빈 방향.
다음 14일 동안의 고온 및 저온 변화 곡선 차트
향후 14일 동안의 고온 및 저온 변화를 통계하고 점선을 사용하여 평균 기온 선을 그려서 변화 곡선을 그립니다.
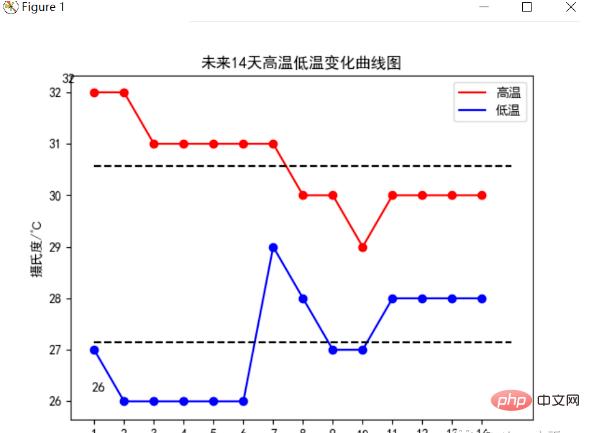
분석 결과, 향후 14일 평균 최고 기온은 30.5℃로 여전히 높은 편이지만, 앞으로 8일째는 추위에 대비해야 합니다. 저온은 안정적인 추세를 보이고 있으며 8일째부터 감소하기 시작하여 고온도 떨어지면서 전체 기온도 떨어지며 평균 저온은 27°C 안팎을 기록했습니다.
다음 14일 동안의 풍향 및 풍속 레이더 차트
향후 14일 동안의 풍향과 평균 풍속을 통계하고 이전과 같이 극좌표를 사용하여 원을 8개 부분으로 나누어 8개의 방향을 나타냅니다. 색상, 풍도가 높을수록 최종 결과는 다음과 같습니다.
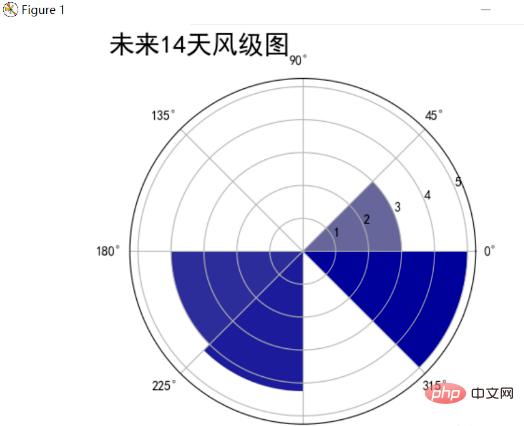
분석 결과 향후 14일 동안 남동풍과 남서풍의 주요 풍향이 가장 높은 풍속이 5단계에 도달하는 것으로 나타났습니다. 가장 낮은 평균 서풍 수준은 레벨 3입니다.
다음 14일 동안의 기후 분포 파이 차트
다음 14일 동안의 기후를 통계하고, 각 기후에 대한 총 일수를 구합니다. 마지막으로, 각 기후에 대한 파이 차트를 그립니다.
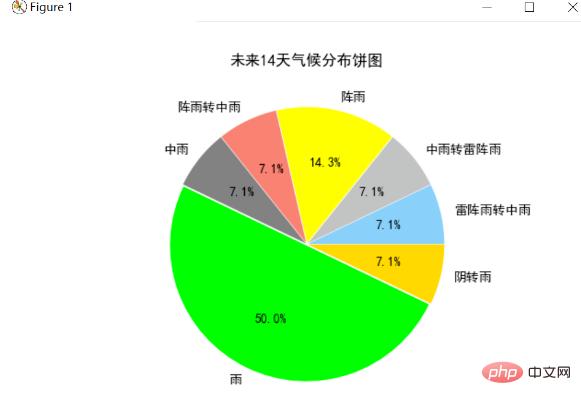
分析可以发现未来14天气候基本是“雨”、“阴转雨”和“阵雨”,下雨的天数较多,结合前面的气温分布图可以看出在第8-9天气温高温下降,可以推测当天下雨,导致气温下降。
3、结论
1.首先根据爬取的温湿度数据进行的分析,温度从早上低到中午高再到晚上低,湿度和温度的趋势相反,通过相关系数发现温度和湿度有强烈的负相关关系,经查阅资料发现因为随着温度升高水蒸汽蒸发加剧,空气中水分降低湿度降低。当然,湿度同时受气压和雨水的影响,下雨湿度会明显增高。
2.经查阅资料空气质量不仅跟工厂、汽车等排放的烟气、废气等有关,更为重要的是与气象因素有关。由于昼夜温差明显变化,当地面温度高于高空温度时,空气上升,污染物易被带到高空扩散;当地面温度低于一定高度的温度时,天空形成逆温层,它像一个大盖子一样压在地面上空,使地表空气中各种污染物不易扩散。一般在晚间和清晨影响较大,而当太阳出来后,地面迅速升温,逆温层就会逐渐消散,于是污染空气也就扩散了。
3.风是由气压在水平方向分布的不均匀导致的。风受大气环流、地形、水域等不同因素的综合影响,表现形式多种多样,如季风、地方性的海陆风、山谷风等,一天的风向也有不同的变化,根据未来14天的风向雷达图可以发现未来所有风向基本都有涉及,并且没有特别的某个风向,原因可能是近期没有降水和气文变化不大,导致风向也没有太大的变化规律。
4.天气是指某一个地区距离地表较近的大气层在短时间内的具体状态。跟某瞬时内大气中各种气象要素分布的综合表现。根据未来14天的天气和温度变化可以大致推断出某个时间的气候,天气和温度之间也是有联系的。
4、代码框架
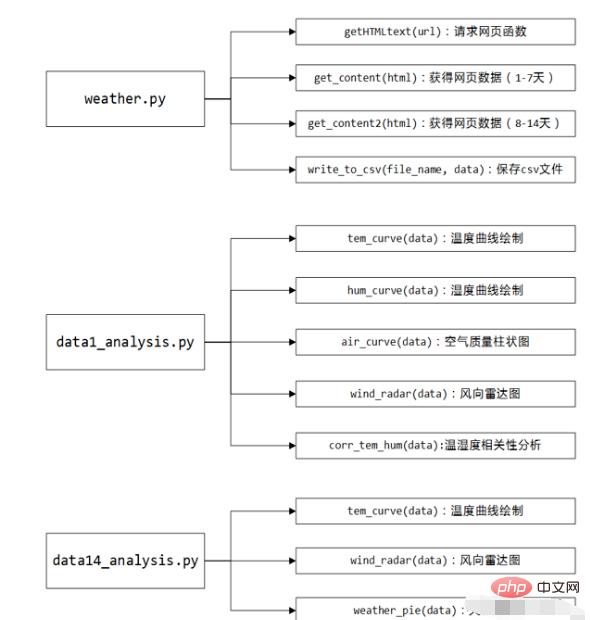
代码主要分为weather.py:对中国天气网进行爬取天气数据并保存csv文件;data1_analysis.py:对当天的天气信息进行可视化处理;data14_analysis.py:对未来14天的天气信息进行可视化处理。下面是代码的结构图:
附源代码
weather.py
# weather.py
import requests
from bs4 import BeautifulSoup
import csv
import json
def getHTMLtext(url):
"""请求获得网页内容"""
 try:
r = requests.get(url, timeout = 30)
r.raise_for_status()
r.encoding = r.apparent_encoding
print("成功访问")
return r.text
 except:
print("访问错误")
return" "
def get_content(html):
"""处理得到有用信息保存数据文件"""
final = []# 初始化一个列表保存数据
bs = BeautifulSoup(html, "html.parser")# 创建BeautifulSoup对象
body = bs.body
data = body.find('div', {<!-- -->'id': '7d'})# 找到div标签且id = 7d
# 下面爬取当天的数据
data2 = body.find_all('div',{<!-- -->'class':'left-div'})
text = data2[2].find('script').string
text = text[text.index('=')+1 :-2] # 移除改var data=将其变为json数据
jd = json.loads(text)
dayone = jd['od']['od2'] # 找到当天的数据
final_day = [] # 存放当天的数据
count = 0
for i in dayone:
 temp = []
 if count <=23:
temp.append(i['od21']) # 添加时间
temp.append(i['od22']) # 添加当前时刻温度
temp.append(i['od24']) # 添加当前时刻风力方向
temp.append(i['od25']) # 添加当前时刻风级
temp.append(i['od26']) # 添加当前时刻降水量
temp.append(i['od27']) # 添加当前时刻相对湿度
temp.append(i['od28']) # 添加当前时刻控制质量
#print(temp)
final_day.append(temp)
 count = count +1
 # 下面爬取7天的数据
ul = data.find('ul')# 找到所有的ul标签
li = ul.find_all('li')# 找到左右的li标签
i = 0 # 控制爬取的天数
for day in li:# 遍历找到的每一个li
if i < 7 and i > 0:
temp = []# 临时存放每天的数据
date = day.find('h1').string # 得到日期
date = date[0:date.index('日')] # 取出日期号
temp.append(date)
inf = day.find_all('p')# 找出li下面的p标签,提取第一个p标签的值,即天气
temp.append(inf[0].string)
tem_low = inf[1].find('i').string # 找到最低气温
if inf[1].find('span') is None: # 天气预报可能没有最高气温
tem_high = None
else:
tem_high = inf[1].find('span').string# 找到最高气温
temp.append(tem_low[:-1])
if tem_high[-1] == '℃':
 temp.append(tem_high[:-1])
else:
 temp.append(tem_high)
wind = inf[2].find_all('span')# 找到风向
for j in wind:
 temp.append(j['title'])
wind_scale = inf[2].find('i').string # 找到风级
index1 = wind_scale.index('级')
temp.append(int(wind_scale[index1-1:index1]))
final.append(temp)
i = i + 1
return final_day,final
#print(final)
def get_content2(html):
"""处理得到有用信息保存数据文件"""
final = []# 初始化一个列表保存数据
bs = BeautifulSoup(html, "html.parser")# 创建BeautifulSoup对象
body = bs.body
data = body.find('div', {<!-- -->'id': '15d'})# 找到div标签且id = 15d
ul = data.find('ul')# 找到所有的ul标签
li = ul.find_all('li')# 找到左右的li标签
final = []
i = 0 # 控制爬取的天数
for day in li: # 遍历找到的每一个li
if i < 8:
temp = [] # 临时存放每天的数据
date = day.find('span',{<!-- -->'class':'time'}).string# 得到日期
date = date[date.index('(')+1:-2]# 取出日期号
temp.append(date)
weather = day.find('span',{<!-- -->'class':'wea'}).string# 找到天气
temp.append(weather)
tem = day.find('span',{<!-- -->'class':'tem'}).text# 找到温度
temp.append(tem[tem.index('/')+1:-1]) # 找到最低气温
temp.append(tem[:tem.index('/')-1])# 找到最高气温
wind = day.find('span',{<!-- -->'class':'wind'}).string# 找到风向
if '转' in wind: # 如果有风向变化
 temp.append(wind[:wind.index('转')])
 temp.append(wind[wind.index('转')+1:])
else: # 如果没有风向变化,前后风向一致
 temp.append(wind)
 temp.append(wind)
wind_scale = day.find('span',{<!-- -->'class':'wind1'}).string# 找到风级
index1 = wind_scale.index('级')
temp.append(int(wind_scale[index1-1:index1]))
final.append(temp)
return final
def write_to_csv(file_name, data, day=14):
"""保存为csv文件"""
with open(file_name, 'a', errors='ignore', newline='') as f:
 if day == 14:
header = ['日期','天气','最低气温','最高气温','风向1','风向2','风级']
 else:
header = ['小时','温度','风力方向','风级','降水量','相对湿度','空气质量']
 f_csv = csv.writer(f)
 f_csv.writerow(header)
 f_csv.writerows(data)
def main():
"""主函数"""
print("Weather test")
# 珠海
url1 = 'http://www.weather.com.cn/weather/101280701.shtml'# 7天天气中国天气网
url2 = 'http://www.weather.com.cn/weather15d/101280701.shtml' # 8-15天天气中国天气网
html1 = getHTMLtext(url1)
data1, data1_7 = get_content(html1)# 获得1-7天和当天的数据
html2 = getHTMLtext(url2)
data8_14 = get_content2(html2) # 获得8-14天数据
data14 = data1_7 + data8_14
#print(data)
write_to_csv('weather14.csv',data14,14) # 保存为csv文件
write_to_csv('weather1.csv',data1,1)
if __name__ == '__main__':
main()
data1_analysis.py:
# data1_analysis.py
import matplotlib.pyplot as plt
import numpy as np
import pandas as pd
import math
def tem_curve(data):
"""温度曲线绘制"""
hour = list(data['小时'])
tem = list(data['温度'])
for i in range(0,24):
 if math.isnan(tem[i]) == True:
tem[i] = tem[i-1]
 tem_ave = sum(tem)/24 # 求平均温度
tem_max = max(tem)
tem_max_hour = hour[tem.index(tem_max)] # 求最高温度
tem_min = min(tem)
tem_min_hour = hour[tem.index(tem_min)] # 求最低温度
x = []
y = []
for i in range(0, 24):
 x.append(i)
 y.append(tem[hour.index(i)])
plt.figure(1)
plt.plot(x,y,color='red',label='温度') # 画出温度曲线
plt.scatter(x,y,color='red') # 点出每个时刻的温度点
plt.plot([0, 24], [tem_ave, tem_ave], c='blue', linestyle='--',label='平均温度')# 画出平均温度虚线
plt.text(tem_max_hour+0.15, tem_max+0.15, str(tem_max), ha='center', va='bottom', fontsize=10.5)# 标出最高温度
plt.text(tem_min_hour+0.15, tem_min+0.15, str(tem_min), ha='center', va='bottom', fontsize=10.5)# 标出最低温度
plt.xticks(x)
plt.legend()
plt.title('一天温度变化曲线图')
plt.xlabel('时间/h')
plt.ylabel('摄氏度/℃')
plt.show()
def hum_curve(data):
"""相对湿度曲线绘制"""
hour = list(data['小时'])
hum = list(data['相对湿度'])
for i in range(0,24):
 if math.isnan(hum[i]) == True:
hum[i] = hum[i-1]
 hum_ave = sum(hum)/24 # 求平均相对湿度
hum_max = max(hum)
hum_max_hour = hour[hum.index(hum_max)] # 求最高相对湿度
hum_min = min(hum)
hum_min_hour = hour[hum.index(hum_min)] # 求最低相对湿度
x = []
y = []
for i in range(0, 24):
 x.append(i)
 y.append(hum[hour.index(i)])
plt.figure(2)
plt.plot(x,y,color='blue',label='相对湿度') # 画出相对湿度曲线
plt.scatter(x,y,color='blue') # 点出每个时刻的相对湿度
plt.plot([0, 24], [hum_ave, hum_ave], c='red', linestyle='--',label='平均相对湿度')# 画出平均相对湿度虚线
plt.text(hum_max_hour+0.15, hum_max+0.15, str(hum_max), ha='center', va='bottom', fontsize=10.5)# 标出最高相对湿度
plt.text(hum_min_hour+0.15, hum_min+0.15, str(hum_min), ha='center', va='bottom', fontsize=10.5)# 标出最低相对湿度
plt.xticks(x)
plt.legend()
plt.title('一天相对湿度变化曲线图')
plt.xlabel('时间/h')
plt.ylabel('百分比/%')
plt.show()
def air_curve(data):
"""空气质量曲线绘制"""
hour = list(data['小时'])
air = list(data['空气质量'])
print(type(air[0]))
for i in range(0,24):
 if math.isnan(air[i]) == True:
air[i] = air[i-1]
 air_ave = sum(air)/24 # 求平均空气质量
air_max = max(air)
air_max_hour = hour[air.index(air_max)] # 求最高空气质量
air_min = min(air)
air_min_hour = hour[air.index(air_min)] # 求最低空气质量
x = []
y = []
for i in range(0, 24):
 x.append(i)
 y.append(air[hour.index(i)])
plt.figure(3)

for i in range(0,24):
 if y[i] <= 50:
plt.bar(x[i],y[i],color='lightgreen',width=0.7)# 1等级
 elif y[i] <= 100:
plt.bar(x[i],y[i],color='wheat',width=0.7) # 2等级
 elif y[i] <= 150:
plt.bar(x[i],y[i],color='orange',width=0.7) # 3等级
 elif y[i] <= 200:
plt.bar(x[i],y[i],color='orangered',width=0.7)# 4等级
 elif y[i] <= 300:
plt.bar(x[i],y[i],color='darkviolet',width=0.7)# 5等级
 elif y[i] > 300:
plt.bar(x[i],y[i],color='maroon',width=0.7) # 6等级
plt.plot([0, 24], [air_ave, air_ave], c='black', linestyle='--')# 画出平均空气质量虚线
plt.text(air_max_hour+0.15, air_max+0.15, str(air_max), ha='center', va='bottom', fontsize=10.5)# 标出最高空气质量
plt.text(air_min_hour+0.15, air_min+0.15, str(air_min), ha='center', va='bottom', fontsize=10.5)# 标出最低空气质量
plt.xticks(x)
plt.title('一天空气质量变化曲线图')
plt.xlabel('时间/h')
plt.ylabel('空气质量指数AQI')
plt.show()
def wind_radar(data):
"""风向雷达图"""
wind = list(data['风力方向'])
wind_speed = list(data['风级'])
for i in range(0,24):
 if wind[i] == "北风":
wind[i] = 90
 elif wind[i] == "南风":
wind[i] = 270
 elif wind[i] == "西风":
wind[i] = 180
 elif wind[i] == "东风":
wind[i] = 360
 elif wind[i] == "东北风":
wind[i] = 45
 elif wind[i] == "西北风":
wind[i] = 135
 elif wind[i] == "西南风":
wind[i] = 225
 elif wind[i] == "东南风":
wind[i] = 315
degs = np.arange(45,361,45)
temp = []
for deg in degs:
 speed = []
 # 获取 wind_deg 在指定范围的风速平均值数据
 for i in range(0,24):
if wind[i] == deg:
 speed.append(wind_speed[i])
 if len(speed) == 0:
temp.append(0)
 else:
temp.append(sum(speed)/len(speed))
print(temp)
N = 8
theta = np.arange(0.+np.pi/8,2*np.pi+np.pi/8,2*np.pi/8)
# 数据极径
radii = np.array(temp)
# 绘制极区图坐标系
plt.axes(polar=True)
# 定义每个扇区的RGB值(R,G,B),x越大,对应的颜色越接近蓝色
colors = [(1-x/max(temp), 1-x/max(temp),0.6) for x in radii]
plt.bar(theta,radii,width=(2*np.pi/N),bottom=0.0,color=colors)
plt.title('一天风级图',x=0.2,fontsize=20)
plt.show()
def calc_corr(a, b):
"""计算相关系数"""
a_avg = sum(a)/len(a)
b_avg = sum(b)/len(b)
cov_ab = sum([(x - a_avg)*(y - b_avg) for x,y in zip(a, b)])
 sq = math.sqrt(sum([(x - a_avg)**2 for x in a])*sum([(x - b_avg)**2 for x in b]))
corr_factor = cov_ab/sq
return corr_factor
def corr_tem_hum(data):
"""温湿度相关性分析"""
tem = data['温度']
hum = data['相对湿度']
plt.scatter(tem,hum,color='blue')
plt.title("温湿度相关性分析图")
plt.xlabel("温度/℃")
plt.ylabel("相对湿度/%")
plt.text(20,40,"相关系数为:"+str(calc_corr(tem,hum)),fontdict={<!-- -->'size':'10','color':'red'})
plt.show()
print("相关系数为:"+str(calc_corr(tem,hum)))
def main():
plt.rcParams['font.sans-serif']=['SimHei'] # 解决中文显示问题
plt.rcParams['axes.unicode_minus'] = False# 解决负号显示问题
data1 = pd.read_csv('weather1.csv',encoding='gb2312')
print(data1)
tem_curve(data1)
hum_curve(data1)
air_curve(data1)
wind_radar(data1)
corr_tem_hum(data1)
if __name__ == '__main__':
main()
data14_analysis.py:
# data14_analysis.py
import matplotlib.pyplot as plt
import numpy as np
import pandas as pd
import math
def tem_curve(data):
"""温度曲线绘制"""
date = list(data['日期'])
tem_low = list(data['最低气温'])
tem_high = list(data['最高气温'])
for i in range(0,14):
 if math.isnan(tem_low[i]) == True:
tem_low[i] = tem_low[i-1]
 if math.isnan(tem_high[i]) == True:
tem_high[i] = tem_high[i-1]
 tem_high_ave = sum(tem_high)/14 # 求平均高温
 tem_low_ave = sum(tem_low)/14 # 求平均低温

tem_max = max(tem_high)
tem_max_date = tem_high.index(tem_max) # 求最高温度
tem_min = min(tem_low)
tem_min_date = tem_low.index(tem_min) # 求最低温度
x = range(1,15)
plt.figure(1)
plt.plot(x,tem_high,color='red',label='高温')# 画出高温度曲线
plt.scatter(x,tem_high,color='red') # 点出每个时刻的温度点
plt.plot(x,tem_low,color='blue',label='低温')# 画出低温度曲线
plt.scatter(x,tem_low,color='blue') # 点出每个时刻的温度点

plt.plot([1, 15], [tem_high_ave, tem_high_ave], c='black', linestyle='--')# 画出平均温度虚线
plt.plot([1, 15], [tem_low_ave, tem_low_ave], c='black', linestyle='--')# 画出平均温度虚线
plt.legend()
plt.text(tem_max_date+0.15, tem_max+0.15, str(tem_max), ha='center', va='bottom', fontsize=10.5)# 标出最高温度
plt.text(tem_min_date+0.15, tem_min+0.15, str(tem_min), ha='center', va='bottom', fontsize=10.5)# 标出最低温度
plt.xticks(x)
plt.title('未来14天高温低温变化曲线图')
plt.xlabel('未来天数/天')
plt.ylabel('摄氏度/℃')
plt.show()
def change_wind(wind):
"""改变风向"""
for i in range(0,14):
 if wind[i] == "北风":
wind[i] = 90
 elif wind[i] == "南风":
wind[i] = 270
 elif wind[i] == "西风":
wind[i] = 180
 elif wind[i] == "东风":
wind[i] = 360
 elif wind[i] == "东北风":
wind[i] = 45
 elif wind[i] == "西北风":
wind[i] = 135
 elif wind[i] == "西南风":
wind[i] = 225
 elif wind[i] == "东南风":
wind[i] = 315
return wind
def wind_radar(data):
"""风向雷达图"""
wind1 = list(data['风向1'])
wind2 = list(data['风向2'])
wind_speed = list(data['风级'])
wind1 = change_wind(wind1)
wind2 = change_wind(wind2)

degs = np.arange(45,361,45)
temp = []
for deg in degs:
 speed = []
 # 获取 wind_deg 在指定范围的风速平均值数据
 for i in range(0,14):
if wind1[i] == deg:
 speed.append(wind_speed[i])
if wind2[i] == deg:
 speed.append(wind_speed[i])
 if len(speed) == 0:
temp.append(0)
 else:
temp.append(sum(speed)/len(speed))
print(temp)
N = 8
theta = np.arange(0.+np.pi/8,2*np.pi+np.pi/8,2*np.pi/8)
# 数据极径
radii = np.array(temp)
# 绘制极区图坐标系
plt.axes(polar=True)
# 定义每个扇区的RGB值(R,G,B),x越大,对应的颜色越接近蓝色
colors = [(1-x/max(temp), 1-x/max(temp),0.6) for x in radii]
plt.bar(theta,radii,width=(2*np.pi/N),bottom=0.0,color=colors)
plt.title('未来14天风级图',x=0.2,fontsize=20)
plt.show()
def weather_pie(data):
"""绘制天气饼图"""
weather = list(data['天气'])
dic_wea = {<!-- --> }
for i in range(0,14):
 if weather[i] in dic_wea.keys():
dic_wea[weather[i]] += 1
 else:
dic_wea[weather[i]] = 1
print(dic_wea)
explode=[0.01]*len(dic_wea.keys())
color = ['lightskyblue','silver','yellow','salmon','grey','lime','gold','red','green','pink']
plt.pie(dic_wea.values(),explode=explode,labels=dic_wea.keys(),autopct='%1.1f%%',colors=color)
plt.title('未来14天气候分布饼图')
plt.show()
def main():
plt.rcParams['font.sans-serif']=['SimHei'] # 解决中文显示问题
plt.rcParams['axes.unicode_minus'] = False# 解决负号显示问题
data14 = pd.read_csv('weather14.csv',encoding='gb2312')
print(data14)
tem_curve(data14)
wind_radar(data14)
weather_pie(data14)
if __name__ == '__main__':
main()
위 내용은 Python은 날씨 데이터와 시각적 분석을 크롤링합니다.의 상세 내용입니다. 자세한 내용은 PHP 중국어 웹사이트의 기타 관련 기사를 참조하세요!

