Python을 사용하여 영화 추천 시스템 구축
- WBOYWBOYWBOYWBOYWBOYWBOYWBOYWBOYWBOYWBOYWBOYWBOYWB앞으로
- 2023-04-12 13:13:072421검색
일상적인 데이터 마이닝 작업에서는 분류 또는 예측 작업을 처리하기 위해 Python을 사용하는 것 외에도 때로는 추천 시스템과 관련된 작업도 포함됩니다.
추천 시스템은 다양한 분야에서 사용되며, 일반적인 예로는 비디오 및 음악 서비스용 재생 목록 생성기, 온라인 상점용 제품 추천기, 소셜 미디어 플랫폼용 콘텐츠 추천기 등이 있습니다. 이 프로젝트에서는 영화 추천자를 만듭니다.
협업 필터링은 많은 사용자의 선호도나 취향 정보를 수집하여 사용자의 관심분야를 자동으로 예측(필터링)합니다. 추천 시스템은 지금까지 오랫동안 개발되어 왔으며 그 모델은 가중 평균, 상관 관계, 기계 학습, 딥 러닝 등 다양한 기술을 기반으로 합니다.
Movielens 20M 데이터 세트에는 1995년 이후 2천만 개가 넘는 영화 평가 및 태그 지정 이벤트가 있습니다. 이 기사에서는 movie.csv 및 rating.csv 파일에서 정보를 검색합니다. Python 라이브러리(Pandas, Seaborn, Scikit-learn 및 SciPy)를 사용하여 k-최근접 이웃 알고리즘에서 코사인 유사성을 사용하여 모델을 훈련합니다.
다음은 프로젝트의 핵심 단계입니다.
- 데이터 세트 가져오기 및 병합 및 Pandas DataFrame 생성
- 데이터 분석에 필요한 기능 추가
- Seaborn을 사용하여 데이터 시각화 및 데이터 분석
- 설정을 통해 잘못된 데이터 필터링 임계값
- 사용자를 인덱스로, 영화를 열로 포함하는 피벗 테이블을 생성합니다.
- KNN 모델을 생성하고 각 영화와 유사한 5개의 권장 사항을 출력합니다.
데이터 가져오기
데이터 세트를 가져오고 병합하고 Pandas DataFrame을 생성합니다
MovieLens 20M 이상의 데이터 세트 1995년 이후 2천만 건의 영화 평가 및 태깅 활동.
# usecols 允许选择自己选择的特征,并通过dtype设定对应类型
movies_df=pd.read_csv('movies.csv',
usecols=['movieId','title'],
dtype={'movieId':'int32','title':'str'})
movies_df.head()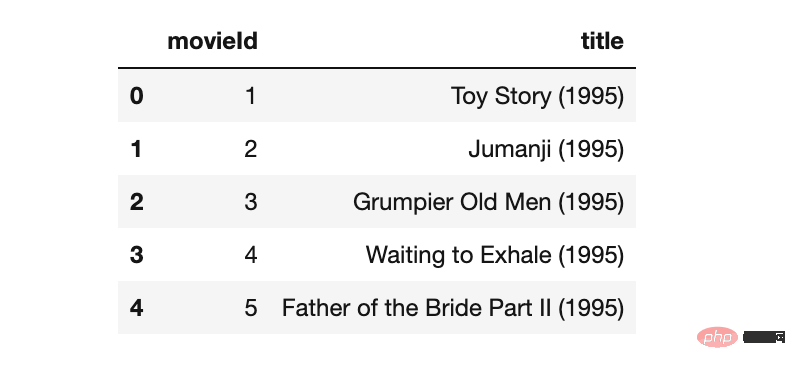
ratings_df=pd.read_csv('ratings.csv',
 usecols=['userId', 'movieId', 'rating','timestamp'],
 dtype={'userId': 'int32', 'movieId': 'int32', 'rating': 'float32'})
ratings_df.head()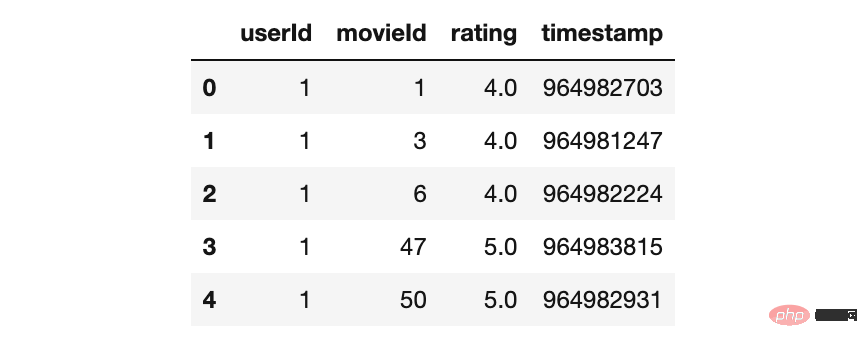
두 데이터 모두에 null 값과 항목 수가 있는지 확인합니다.
# 检查缺失值
movies_df.isnull().sum()
movieId 0
title 0
dtype: int64
ratings_df.isnull().sum()
userId 0
movieId 0
rating 0
timestamp 0
dtype: int 64
print("Movies:",movies_df.shape)
print("Ratings:",ratings_df.shape)
영화: (9742, 2 )
평점: (100836, 4)
'movieId' 열의 데이터 프레임 병합
# movies_df.info()
# ratings_df.info()
movies_merged_df=movies_df.merge(ratings_df, on='movieId')
movies_merged_df.head()
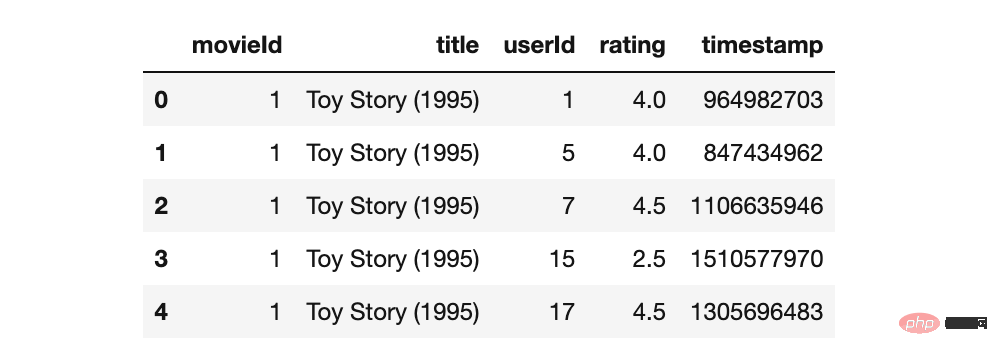
이제 가져온 데이터 세트가 성공적으로 병합되었습니다.
파생 기능 추가
데이터 분석에 필요한 기능을 추가하세요.
영화 제목별로 사용자 평가를 그룹화하여 '평균 평점' 및 '평가 개수' 열을 만듭니다.
movies_average_rating=movies_merged_df.groupby('title')['rating']
 .mean().sort_values(ascending=False)
.reset_index().rename(columns={'rating':'Average Rating'})
movies_average_rating.head()
movies_rating_count=movies_merged_df.groupby('title')['rating']
.count().sort_values(ascending=True)
 .reset_index().rename(columns={'rating':'Rating Count'}) #ascending=False
movies_rating_count_avg=movies_rating_count.merge(movies_average_rating, on='title')
movies_rating_count_avg.head()
현재 2개의 새로운 파생 기능이 생성되었습니다.
데이터 시각화
Seaborn을 사용하여 데이터 시각화:
- 분석 후 많은 영화가 거의 100,000개의 사용자 평가 데이터 세트에서 완벽한 별 5개 평균 평점을 받은 것으로 나타났습니다. 이는 이상값이 있음을 나타내며 시각화를 통해 추가로 확인해야 합니다.
- 많은 영화의 평점은 상대적으로 단일합니다. 가치 있는 추천을 생성하려면 평점 임계값을 설정하는 것이 좋습니다.
seaborn과 matplotlib를 사용하여 데이터를 시각화하여 데이터를 더 잘 관찰하고 분석하세요.
새로 생성된 특성의 히스토그램을 그리고 분포를 확인하세요. bin 크기를 80으로 설정합니다. 이 값을 설정하려면 자세한 분석과 합리적인 설정이 필요합니다.
# 导入可视化库
import seaborn as sns
import matplotlib.pyplot as plt
sns.set(font_scale = 1)
plt.rcParams["axes.grid"] = False
plt.style.use('dark_background')
%matplotlib inline

# 绘制图形
plt.figure(figsize=(12,4))
plt.hist(movies_rating_count_avg['Rating Count'],bins=80,color='tab:purple')
plt.ylabel('Ratings Count(Scaled)', fontsize=16)
plt.savefig('ratingcounthist.jpg')

plt.figure(figsize=(12,4))
plt.hist(movies_rating_count_avg['Average Rating'],bins=80,color='tab:purple')
plt.ylabel('Average Rating',fontsize=16)
plt.savefig('avgratinghist.jpg')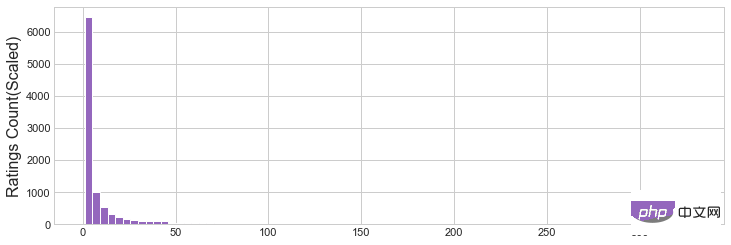
그림 1 평균 평점 히스토그램
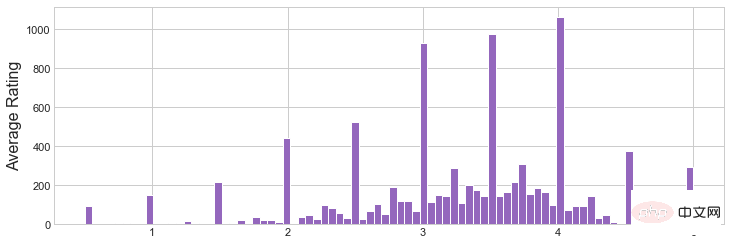
그림 2 평점 개수 히스토그램
이제 이 두 가지 기능을 함께 시각화하는 Joinplot 2D 차트를 만듭니다.
plot=sns.jointplot(x='Average Rating',
 y='Rating Count',
 data=movies_rating_count_avg,
 alpha=0.5,
 color='tab:pink')
plot.savefig('joinplot.jpg')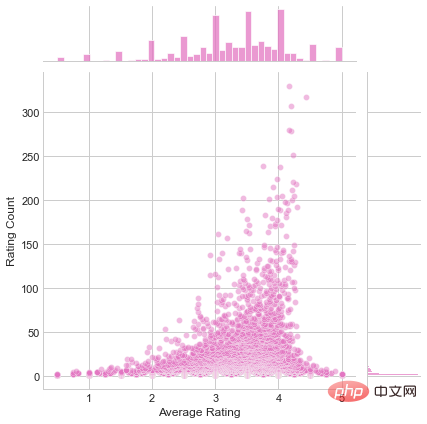
평균 평점과 평점 개수의 2차원 그래프
分析
- 图1证实了,大部分电影的评分都是较低的。除了设置阈值之外,我们还可以在这个用例中使用一些更高百分比的分位数。
- 直方图 2 展示了“Average Rating”的分布函数。
数据清洗
运用describe()函数得到数据集的描述统计值,如分位数和标准差等。
pd.set_option('display.float_format', lambda x: '%.3f' % x)
print(rating_with_RatingCount['Rating Count'].describe())
count 100836.000 mean58.759 std 61.965 min1.000 25% 13.000 50% 39.000 75% 84.000 max329.000 Name: Rating Count, dtype: float64
设置阈值并筛选出高于阈值的数据。
popularity_threshold = 50
popular_movies= rating_with_RatingCount[
rating_with_RatingCount['Rating Count']>=popularity_threshold]
popular_movies.head()
# popular_movies.shape
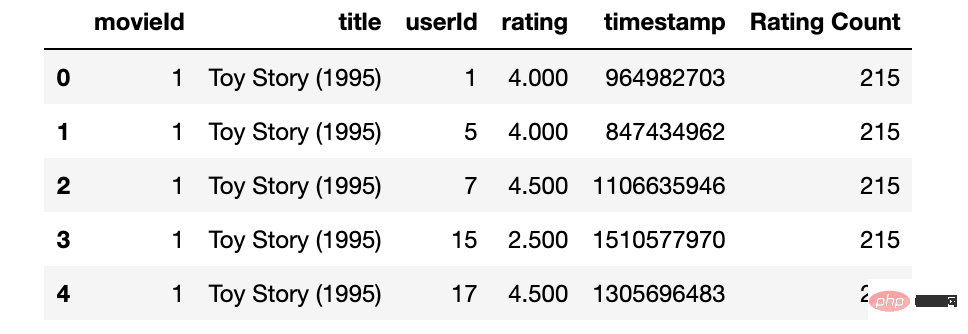
至此已经通过过滤掉了评论低于阈值的电影来清洗数据。
创建数据透视表
创建一个以用户为索引、以电影为列的数据透视表
为了稍后将数据加载到模型中,需要创建一个数据透视表。并设置'title'作为索引,'userId'为列,'rating'为值。
import os
movie_features_df=popular_movies.pivot_table(
index='title',columns='userId',values='rating').fillna(0)
movie_features_df.head()
movie_features_df.to_excel('output.xlsx')
接下来将创建的数据透视表加载到模型。
建立 kNN 模型
建立 kNN 模型并输出与每部电影相似的 5 个推荐
使用scipy.sparse模块中的csr_matrix方法,将数据透视表转换为用于拟合模型的数组矩阵。
from scipy.sparse import csr_matrix
movie_features_df_matrix = csr_matrix(movie_features_df.values)
最后,使用之前生成的矩阵数据,来训练来自sklearn中的NearestNeighbors算法。并设置参数:metric = 'cosine', algorithm = 'brute'
from sklearn.neighbors import NearestNeighbors
model_knn = NearestNeighbors(metric = 'cosine',
 algorithm = 'brute')
model_knn.fit(movie_features_df_matrix)
现在向模型传递一个索引,根据'kneighbors'算法要求,需要将数据转换为单行数组,并设置n_neighbors的值。
query_index = np.random.choice(movie_features_df.shape[0])
distances, indices = model_knn.kneighbors(movie_features_df.iloc[query_index,:].values.reshape(1, -1),
n_neighbors = 6)
最后在 query_index 中输出出电影推荐。
for i in range(0, len(distances.flatten())):
if i == 0:
print('Recommendations for {0}:n'
.format(movie_features_df.index[query_index]))
else:
print('{0}: {1}, with distance of {2}:'
.format(i, movie_features_df.index[indices.flatten()[i]],
distances.flatten()[i]))
Recommendations for Harry Potter and the Order of the Phoenix (2007): 1: Harry Potter and the Half-Blood Prince (2009), with distance of 0.2346513867378235: 2: Harry Potter and the Order of the Phoenix (2007), with distance of 0.3396233320236206: 3: Harry Potter and the Goblet of Fire (2005), with distance of 0.4170845150947571: 4: Harry Potter and the Prisoner of Azkaban (2004), with distance of 0.4499547481536865: 5: Harry Potter and the Chamber of Secrets (2002), with distance of 0.4506162405014038:
至此我们已经能够成功构建了一个仅基于用户评分的推荐引擎。
总结
以下是我们构建电影推荐系统的步骤摘要:
- 导入和合并数据集并创建 Pandas DataFrame
- 为了更好分析数据创建衍生变量
- 使用 Seaborn 可视化数据
- 通过设置阈值来清洗数据
- 创建了一个以用户为索引、以电影为列的数据透视表
- 建立一个 kNN 模型,并输出 5 个与每部电影最相似的推荐
写在最后
以下是可以扩展项目的一些方法:
- 这个数据集不是很大,可以在项目中的包含数据集中的其他文件来扩展这个项目的范围。
- 可以利用' ratings.csv' 中时间戳,分析评级在一段时间内的变化情况,并且可以在解析我们的模型时,根据时间戳对评级进行加权。
- 该模型的性能远优于加权平均或相关模型,但仍有提升的空间,如使用高级 ML 算法甚至 DL 模型。
위 내용은 Python을 사용하여 영화 추천 시스템 구축의 상세 내용입니다. 자세한 내용은 PHP 중국어 웹사이트의 기타 관련 기사를 참조하세요!

