흥미로운 Python 시각화 기술 공유
- WBOY앞으로
- 2023-04-12 08:22:141724검색

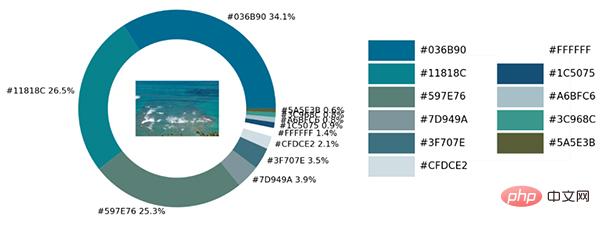
아래 그림과 같이
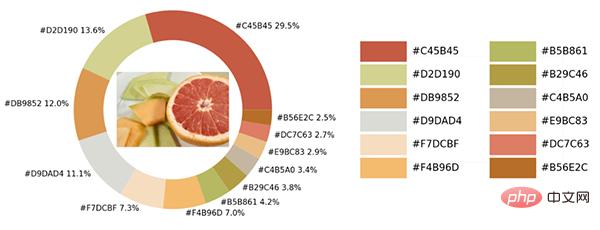
샘플 사진에는 다양한 색상이 있습니다. Python의 시각화 모듈과 opencv 모듈을 사용하여 사진의 모든 색상 요소를 식별하고 변환해 보겠습니다. 시각화 차트의 색 구성표.
모듈 가져오기 및 그림 로드
늘 그렇듯 첫 번째 단계는 모듈을 가져오는 것입니다. 시각화에 사용되는 모듈은 그림의 색상을 추출한 후 색상 매핑에 저장됩니다. 테이블이 필요하므로 컬러맵 모듈을 사용할 때 이 모듈도 가져와야 합니다.
import numpy as np
import pandas as pd
import matplotlib.pyplot as plt
import matplotlib.patches as patches
import matplotlib.image as mpimg
from PIL import Image
from matplotlib.offsetbox import OffsetImage, AnnotationBbox
import cv2
import extcolors
from colormap import rgb2hex
그럼 먼저 이미지를 로드해 보겠습니다. 코드는 다음과 같습니다.
input_name = 'test_1.png'
img = plt.imread(input_name)
plt.imshow(img)
plt.axis('off')
plt.show()
output
색상을 추출하여 테이블에 통합합니다.
extcolors 모듈을 호출하여 이미지에서 색상을 추출하면 출력 결과가 표시됩니다. RGB 형식 색상에서 코드는 다음과 같습니다.
colors_x = extcolors.extract_from_path(img_url, tolerance=12, limit = 12)
colors_x
output
([((3, 107, 144), 180316),
 ((17, 129, 140), 139930),
 ((89, 126, 118), 134080),
 ((125, 148, 154), 20636),
 ((63, 112, 126), 18728),
 ((207, 220, 226), 11037),
 ((255, 255, 255), 7496),
 ((28, 80, 117), 4972),
 ((166, 191, 198), 4327),
 ((60, 150, 140), 4197),
 ((90, 94, 59), 3313),
 ((56, 66, 39), 1669)],
538200)
위 결과를 DataFrame 데이터 세트에 통합합니다. 코드는 다음과 같습니다.
def color_to_df(input_color):
 colors_pre_list = str(input_color).replace('([(', '').split(', (')[0:-1]
 df_rgb = [i.split('), ')[0] + ')' for i in colors_pre_list]
 df_percent = [i.split('), ')[1].replace(')', '') for i in colors_pre_list]
 # 将RGB转换成十六进制的颜色
 df_color_up = [rgb2hex(int(i.split(", ")[0].replace("(", "")),
int(i.split(", ")[1]),
int(i.split(", ")[2].replace(")", ""))) for i in df_rgb]
 df = pd.DataFrame(zip(df_color_up, df_percent), columns=['c_code', 'occurence'])
 return df
위의 사용자 정의 함수를 호출하고 결과를 출력하려고 합니다. DataFrame 데이터 세트에.
df_color = color_to_df(colors_x)
df_color
output
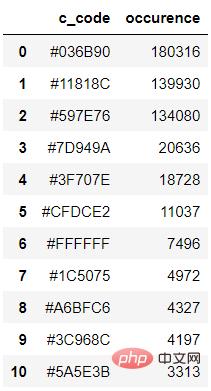
차트 그리기
다음 단계에서는 matplotlib 모듈을 사용합니다. 코드는 다음과 같습니다.
fig, ax = plt.subplots(figsize=(90,90),dpi=10)
wedges, text = ax.pie(list_precent,
 labels= text_c,
 labeldistance= 1.05,
 colors = list_color,
 textprops={'fontsize': 120, 'color':'black'}
)
plt.setp(wedges, width=0.3)
ax.set_aspect("equal")
fig.set_facecolor('white')
plt.show()
output
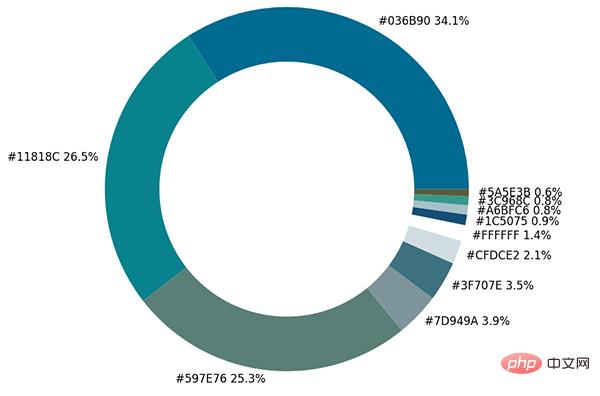
은 원형 차트에서 표시됩니다. 각 색상의 비율을 위해 한 단계 더 나아가 원본 이미지를 링에 배치합니다.
imagebox = OffsetImage(img, zoom=2.3)
ab = AnnotationBbox(imagebox, (0, 0))
ax1.add_artist(ab)
output
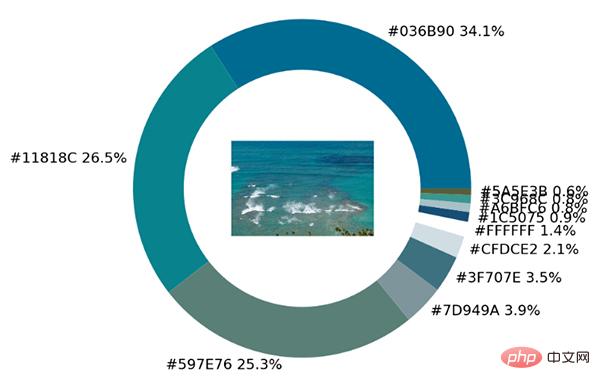
마지막으로 원본 이미지의 다양한 색상을 모두 나열하는 색상 팔레트를 만듭니다. 코드는 다음과 같습니다.
## 调色盘
x_posi, y_posi, y_posi2 = 160, -170, -170
for c in list_color:
 if list_color.index(c) <= 5:
 y_posi += 180
 rect = patches.Rectangle((x_posi, y_posi), 360, 160, facecolor = c)
 ax2.add_patch(rect)
 ax2.text(x = x_posi+400, y = y_posi+100, s = c, fontdict={'fontsize': 190})
 else:
 y_posi2 += 180
 rect = patches.Rectangle((x_posi + 1000, y_posi2), 360, 160, facecolor = c)
 ax2.add_artist(rect)
 ax2.text(x = x_posi+1400, y = y_posi2+100, s = c, fontdict={'fontsize': 190})
ax2.axis('off')
fig.set_facecolor('white')
plt.imshow(bg)
plt.tight_layout()
output
실용적인 링크
이 부분은 실용적입니다. 위의 모든 코드를 완전한 함수로 캡슐화합니다.
def exact_color(input_image, resize, tolerance, zoom):
 output_width = resize
 img = Image.open(input_image)
 if img.size[0] >= resize:
 wpercent = (output_width/float(img.size[0]))
 hsize = int((float(img.size[1])*float(wpercent)))
 img = img.resize((output_width,hsize), Image.ANTIALIAS)
 resize_name = 'resize_'+ input_image
 img.save(resize_name)
 else:
 resize_name = input_image

 fig.set_facecolor('white')
 ax2.axis('off')
 bg = plt.imread('bg.png')
plt.imshow(bg)
 plt.tight_layout()
 return plt.show()

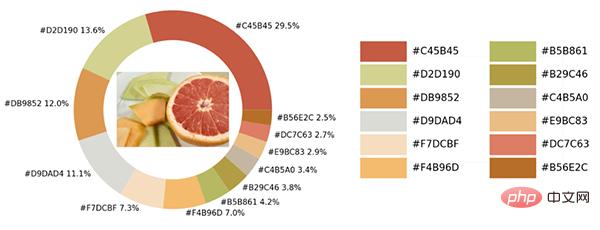
exact_color('test_2.png', 900, 12, 2.5)
출력
위 내용은 흥미로운 Python 시각화 기술 공유의 상세 내용입니다. 자세한 내용은 PHP 중국어 웹사이트의 기타 관련 기사를 참조하세요!
성명:
이 기사는 51cto.com에서 복제됩니다. 침해가 있는 경우 admin@php.cn으로 문의하시기 바랍니다. 삭제

