


Highcharts is a charting library written in pure JavaScript, offering an easy way of adding interactive charts to your web site or web application. Highcharts currently supports line, spline, area, areaspline, column, bar, pie and scatter chart types.
Features
It works in all modern browsers including the iPhone/iPad and Internet Explorer from version 6. Standard browsers use SVG for the graphics rendering. In Internet Explorer graphics are drawn using VML.

.
Highcharts is solely based on native browser technologies and doesn't require client side plugins like Flash or Java. Furthermore you don't need to install anything on your server. No PHP or ASP.NET. Highcharts needs only two JS files to run: The highcharts.js core and either the jQuery or the MooTools framework. One of these frameworks is most likely already in use in your web page.
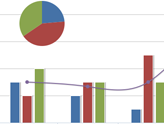
Highcharts supports line, spline, area, areaspline, column, bar, pie and scatter chart types. Any of these can be combined in one chart.
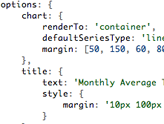
Setting the Highcharts configuration options requires no special programming skills. The options are given in a JavaScript object notation structure, which is basically a set of keys and values connected by colons, separated by commas and grouped by curly brackets.
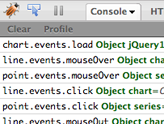
Through a full API you can add, remove and modify series, axes or points at any time after chart creation. Numerous events supply hooks for programming agains the chart. In combination with jQuery's or MooTools' Ajax API, this opens for solutions like live charts constantly updating with values from the server, user supplied data and more.
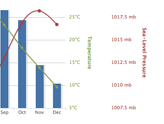
Sometimes you want to compare variables that are not the same scale - for example temperature versus rainfall and air pressure. Highcharts lets you assign an y axis for each series - or an x axis if you want to compare data sets of different categories. Each axis can be placed to the right or left, top or bottom of the chart. All options can be set individually, including reversing, styling and position.
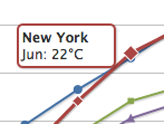
On hovering the chart Highcharts can display a tooltip text with information on each point and series. The tooltip follows as the user moves the mouse over the graph, and great efforts have been taken to make it stick to the nearest point as well as making it easy to read a point that is below another point.
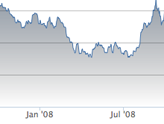
75% of all charts with an X and Y axis have a date-time X axis. Therefore Highchart is very intelligent about time values. With milliseconds axis units, Highcharts determines where to place the ticks so that they always mark the start of the month or the week, midnight and midday, the full hour etc.
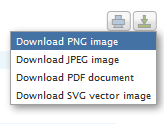
With the exporting module enabled, your users can export the chart to PNG, JPG, PDF or SVG format at the click of a button, or print the chart directly from the web page.
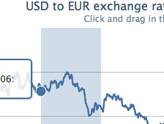
By zooming in on a chart you can examine an especially interesting part of the data more closely. Zooming can be in the X or Y dimension, or both.
Highcharts는 로컬 구성 개체, 별도의 파일 또는 다른 사이트에서 정의할 수 있는 자바스크립트 배열의 데이터를 가져옵니다. 또한 데이터는 어떤 형태로든 Highcharts로 처리될 수 있으며 콜백 함수는 데이터를 배열로 구문 분석하는 데 사용됩니다.
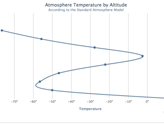
예를 들어 막대 차트에서와 같이 차트를 뒤집어 X축이 수직으로 표시되도록 해야 하는 경우가 있습니다. 가장 높은 값이 origo에 가장 가깝게 표시되도록 축을 바꾸는 것도 지원됩니다.
개인 웹사이트, 학교 사이트 또는 비영리 조직에서 Highcharts를 사용하고 싶으신가요? 그러면 작성자의 허가가 필요하지 않고 계속해서 Highcharts를 사용하세요. 상업용 웹사이트 및 프로젝트의 경우

 JavaScript 데이터 유형 : 브라우저와 Nodejs 사이에 차이가 있습니까?May 14, 2025 am 12:15 AM
JavaScript 코어 데이터 유형은 브라우저 및 Node.js에서 일관되지만 추가 유형과 다르게 처리됩니다. 1) 글로벌 객체는 브라우저의 창이고 node.js의 글로벌입니다. 2) 이진 데이터를 처리하는 데 사용되는 Node.js의 고유 버퍼 객체. 3) 성능 및 시간 처리에는 차이가 있으며 환경에 따라 코드를 조정해야합니다.
 JavaScript 댓글 : / / * * /사용 안내서May 13, 2025 pm 03:49 PM
javaScriptUSTWOTYPESOFSOFCOMMENTS : 단일 라인 (//) 및 multi-line (//)
 Python vs. JavaScript : 개발자를위한 비교 분석May 09, 2025 am 12:22 AM
Python과 JavaScript의 주요 차이점은 유형 시스템 및 응용 프로그램 시나리오입니다. 1. Python은 과학 컴퓨팅 및 데이터 분석에 적합한 동적 유형을 사용합니다. 2. JavaScript는 약한 유형을 채택하며 프론트 엔드 및 풀 스택 개발에 널리 사용됩니다. 두 사람은 비동기 프로그래밍 및 성능 최적화에서 고유 한 장점을 가지고 있으며 선택할 때 프로젝트 요구 사항에 따라 결정해야합니다.
 Python vs. JavaScript : 작업에 적합한 도구 선택May 08, 2025 am 12:10 AM
Python 또는 JavaScript를 선택할지 여부는 프로젝트 유형에 따라 다릅니다. 1) 데이터 과학 및 자동화 작업을 위해 Python을 선택하십시오. 2) 프론트 엔드 및 풀 스택 개발을 위해 JavaScript를 선택하십시오. Python은 데이터 처리 및 자동화 분야에서 강력한 라이브러리에 선호되는 반면 JavaScript는 웹 상호 작용 및 전체 스택 개발의 장점에 없어서는 안될 필수입니다.
 파이썬 및 자바 스크립트 : 각각의 강점을 이해합니다May 06, 2025 am 12:15 AM
파이썬과 자바 스크립트는 각각 고유 한 장점이 있으며 선택은 프로젝트 요구와 개인 선호도에 따라 다릅니다. 1. Python은 간결한 구문으로 데이터 과학 및 백엔드 개발에 적합하지만 실행 속도가 느립니다. 2. JavaScript는 프론트 엔드 개발의 모든 곳에 있으며 강력한 비동기 프로그래밍 기능을 가지고 있습니다. node.js는 풀 스택 개발에 적합하지만 구문은 복잡하고 오류가 발생할 수 있습니다.
 JavaScript의 핵심 : C 또는 C에 구축 되었습니까?May 05, 2025 am 12:07 AM
javaScriptisNotBuiltoncorc; it'SangretedLanguageThatrunsonOngineStenWrittenInc .1) javaScriptWasDesignEdasAlightweight, 해석 hanguageforwebbrowsers.2) Endinesevolvedfromsimpleplemporectreterstoccilpilers, 전기적으로 개선된다.
 JavaScript 응용 프로그램 : 프론트 엔드에서 백엔드까지May 04, 2025 am 12:12 AM
JavaScript는 프론트 엔드 및 백엔드 개발에 사용할 수 있습니다. 프론트 엔드는 DOM 작업을 통해 사용자 경험을 향상시키고 백엔드는 Node.js를 통해 서버 작업을 처리합니다. 1. 프론트 엔드 예 : 웹 페이지 텍스트의 내용을 변경하십시오. 2. 백엔드 예제 : node.js 서버를 만듭니다.
 Python vs. JavaScript : 어떤 언어를 배워야합니까?May 03, 2025 am 12:10 AM
Python 또는 JavaScript는 경력 개발, 학습 곡선 및 생태계를 기반으로해야합니다. 1) 경력 개발 : Python은 데이터 과학 및 백엔드 개발에 적합한 반면 JavaScript는 프론트 엔드 및 풀 스택 개발에 적합합니다. 2) 학습 곡선 : Python 구문은 간결하며 초보자에게 적합합니다. JavaScript Syntax는 유연합니다. 3) 생태계 : Python에는 풍부한 과학 컴퓨팅 라이브러리가 있으며 JavaScript는 강력한 프론트 엔드 프레임 워크를 가지고 있습니다.


핫 AI 도구

Undresser.AI Undress
사실적인 누드 사진을 만들기 위한 AI 기반 앱

AI Clothes Remover
사진에서 옷을 제거하는 온라인 AI 도구입니다.

Undress AI Tool
무료로 이미지를 벗다

Clothoff.io
AI 옷 제거제

Video Face Swap
완전히 무료인 AI 얼굴 교환 도구를 사용하여 모든 비디오의 얼굴을 쉽게 바꾸세요!

인기 기사
뜨거운 도구

맨티스BT
Mantis는 제품 결함 추적을 돕기 위해 설계된 배포하기 쉬운 웹 기반 결함 추적 도구입니다. PHP, MySQL 및 웹 서버가 필요합니다. 데모 및 호스팅 서비스를 확인해 보세요.

DVWA
DVWA(Damn Vulnerable Web App)는 매우 취약한 PHP/MySQL 웹 애플리케이션입니다. 주요 목표는 보안 전문가가 법적 환경에서 자신의 기술과 도구를 테스트하고, 웹 개발자가 웹 응용 프로그램 보안 프로세스를 더 잘 이해할 수 있도록 돕고, 교사/학생이 교실 환경 웹 응용 프로그램에서 가르치고 배울 수 있도록 돕는 것입니다. 보안. DVWA의 목표는 다양한 난이도의 간단하고 간단한 인터페이스를 통해 가장 일반적인 웹 취약점 중 일부를 연습하는 것입니다. 이 소프트웨어는

Eclipse용 SAP NetWeaver 서버 어댑터
Eclipse를 SAP NetWeaver 애플리케이션 서버와 통합합니다.

안전한 시험 브라우저
안전한 시험 브라우저는 온라인 시험을 안전하게 치르기 위한 보안 브라우저 환경입니다. 이 소프트웨어는 모든 컴퓨터를 안전한 워크스테이션으로 바꿔줍니다. 이는 모든 유틸리티에 대한 액세스를 제어하고 학생들이 승인되지 않은 리소스를 사용하는 것을 방지합니다.

SecList
SecLists는 최고의 보안 테스터의 동반자입니다. 보안 평가 시 자주 사용되는 다양한 유형의 목록을 한 곳에 모아 놓은 것입니다. SecLists는 보안 테스터에게 필요할 수 있는 모든 목록을 편리하게 제공하여 보안 테스트를 더욱 효율적이고 생산적으로 만드는 데 도움이 됩니다. 목록 유형에는 사용자 이름, 비밀번호, URL, 퍼징 페이로드, 민감한 데이터 패턴, 웹 셸 등이 포함됩니다. 테스터는 이 저장소를 새로운 테스트 시스템으로 간단히 가져올 수 있으며 필요한 모든 유형의 목록에 액세스할 수 있습니다.

