[Python-CV이미지 분할 : Canny Edge, Watershed 및 K-Means 방법
- Patricia Arquette원래의
- 2024-12-11 05:33:09970검색
분할은 객체, 모양 또는 색상을 기준으로 이미지를 의미 있는 부분으로 나눌 수 있는 이미지 분석의 기본 기술입니다. 이는 객체 감지, 컴퓨터 비전, 예술적 이미지 조작과 같은 응용 분야에서 중추적인 역할을 합니다. 하지만 어떻게 효과적으로 세분화를 달성할 수 있을까요? 다행스럽게도 OpenCV(cv2)는 사용자에게 친숙하고 강력한 분할 방법을 제공합니다.
이 튜토리얼에서는 세 가지 인기 있는 세분화 기술을 살펴보겠습니다.
- 캐니 에지 감지 – 객체의 윤곽을 잡는 데 적합합니다.
- 유역 알고리즘 – 겹치는 영역을 분리하는 데 적합합니다.
- K-평균 색상 분할 – 이미지에서 유사한 색상을 클러스터링하는 데 이상적입니다.
이 튜토리얼을 흥미롭고 실용적으로 만들기 위해 고대 고분 고분을 중심으로 일본 오사카의 위성 및 항공 사진을 사용하겠습니다. 튜토리얼의 GitHub 페이지에서 이러한 이미지와 해당 샘플 노트북을 다운로드할 수 있습니다.
윤곽 분할에 대한 캐니 에지 감지
캐니 엣지 감지는 이미지의 엣지를 식별하는 간단하면서도 강력한 방법입니다. 이는 종종 물체의 경계인 급격한 강도 변화 영역을 감지하여 작동합니다. 이 기술은 강도 임계값을 적용하여 "얇은 가장자리" 윤곽선을 생성합니다. OpenCV를 사용하여 구현을 살펴보겠습니다.
예: 위성 이미지에서 가장자리 감지
여기서는 오사카의 위성영상, 특히 고분 고분을 테스트 사례로 사용합니다.
import cv2
import numpy as np
import matplotlib.pyplot as plt
files = sorted(glob("SAT*.png")) #Get png files
print(len(files))
img=cv2.imread(files[0])
use_image= img[0:600,700:1300]
gray = cv2.cvtColor(use_image, cv2.COLOR_BGR2GRAY)

#Stadard values
min_val = 100
max_val = 200
# Apply Canny Edge Detection
edges = cv2.Canny(gray, min_val, max_val)
#edges = cv2.Canny(gray, min_val, max_val,apertureSize=5,L2gradient = True )
False
# Show the result
plt.figure(figsize=(15, 5))
plt.subplot(131), plt.imshow(cv2.cvtColor(use_image, cv2.COLOR_BGR2RGB))
plt.title('Original Image'), plt.axis('off')
plt.subplot(132), plt.imshow(gray, cmap='gray')
plt.title('Grayscale Image'), plt.axis('off')
plt.subplot(133), plt.imshow(edges, cmap='gray')
plt.title('Canny Edges'), plt.axis('off')
plt.show()

출력 가장자리에는 고분 고분과 기타 관심 지역의 윤곽이 명확하게 표시됩니다. 그러나 날카로운 임계값으로 인해 일부 영역이 누락되었습니다. 결과는 min_val 및 max_val의 선택과 이미지 품질에 따라 크게 달라집니다.
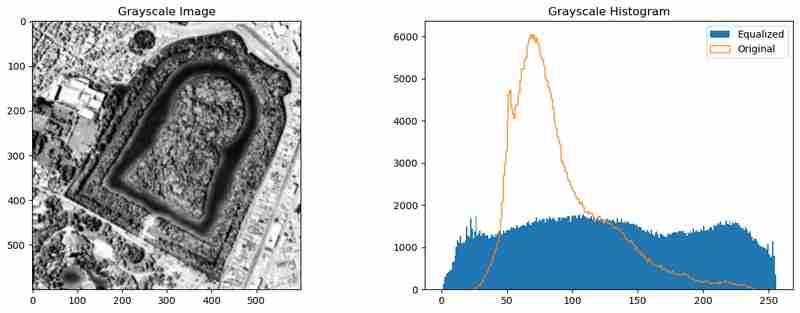
가장자리 감지 기능을 향상시키기 위해 이미지를 전처리하여 픽셀 강도를 분산시키고 노이즈를 줄일 수 있습니다. 이는 히스토그램 균등화(cv2.equalizeHist()) 및 가우스 흐림(cv2.GaussianBlur())을 사용하여 달성할 수 있습니다.
use_image= img[0:600,700:1300]
gray = cv2.cvtColor(use_image, cv2.COLOR_BGR2GRAY)
gray_og = gray.copy()
gray = cv2.equalizeHist(gray)
gray = cv2.GaussianBlur(gray, (9, 9),1)

plt.figure(figsize=(15, 5))
plt.subplot(121), plt.imshow(gray, cmap='gray')
plt.title('Grayscale Image')
plt.subplot(122)
_= plt.hist(gray.ravel(), 256, [0,256],label="Equalized")
_ = plt.hist(gray_og.ravel(), 256, [0,256],label="Original",histtype='step')
plt.legend()
plt.title('Grayscale Histogram')

이러한 전처리는 강도 분포를 고르게 하고 이미지를 부드럽게 하여 Canny Edge 감지 알고리즘이 보다 의미 있는 가장자리를 포착하는 데 도움이 됩니다.
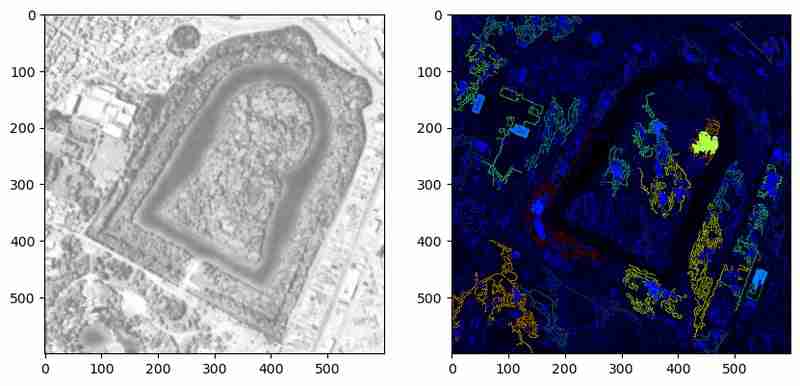
가장자리는 유용하지만 경계만 나타냅니다. 닫힌 영역을 분할하기 위해 가장자리를 윤곽선으로 변환하고 시각화합니다.
# Edges to contours
contours, hierarchy = cv2.findContours(edges, cv2.RETR_TREE, cv2.CHAIN_APPROX_SIMPLE)
# Calculate contour areas
areas = [cv2.contourArea(contour) for contour in contours]

# Normalize areas for the colormap
normalized_areas = np.array(areas)
if normalized_areas.max() > 0:
    normalized_areas = normalized_areas / normalized_areas.max()

# Create a colormap
cmap = plt.cm.jet

# Plot the contours with the color map
plt.figure(figsize=(10, 10))
plt.subplot(1,2,1)
plt.imshow(gray, cmap='gray', alpha=0.5)  # Display the grayscale image in the background
mask = np.zeros_like(use_image)
for contour, norm_area in zip(contours, normalized_areas):
    color = cmap(norm_area)  # Map the normalized area to a color
    color = [int(c*255) for c in color[:3]]
    cv2.drawContours(mask, [contour], -1, color,-1 )  # Draw contours on the image

plt.subplot(1,2,2)

위 방법은 감지된 윤곽을 상대 영역을 나타내는 색상으로 강조 표시합니다. 이 시각화는 윤곽이 닫힌 몸체를 형성하는지, 아니면 단순한 선을 형성하는지 확인하는 데 도움이 됩니다. 그러나 이 예에서는 많은 등고선이 닫히지 않은 다각형으로 남아 있습니다. 추가 전처리 또는 매개변수 조정을 통해 이러한 제한 사항을 해결할 수 있습니다.
전처리와 윤곽 분석을 결합한 Canny Edge 감지는 이미지에서 객체 경계를 식별하는 강력한 도구가 됩니다. 그러나 객체가 잘 정의되고 노이즈가 최소화될 때 가장 잘 작동합니다. 다음으로 K-평균 클러스터링을 탐색하여 이미지를 색상별로 분류하여 동일한 데이터에 대해 다른 관점을 제공하겠습니다.
KMean 클러스터링
K-평균 클러스터링은 유사한 항목을 클러스터로 그룹화하는 데이터 과학에서 널리 사용되는 방법이며, 색상 유사성을 기준으로 이미지를 분할하는 데 특히 효과적입니다. OpenCV의 cv2.kmeans 기능은 이 프로세스를 단순화하여 객체 분할, 배경 제거 또는 시각적 분석과 같은 작업에 액세스할 수 있게 해줍니다.
이 섹션에서는 K-Means Clustering을 사용하여 고분 고분 이미지를 유사한 색상의 영역으로 분할합니다.
시작하려면 이미지의 RGB 값에 K-평균 클러스터링을 적용하여 각 픽셀을 데이터 포인트로 처리합니다.
import cv2
import numpy as np
import matplotlib.pyplot as plt
files = sorted(glob("SAT*.png")) #Get png files
print(len(files))
img=cv2.imread(files[0])
use_image= img[0:600,700:1300]
gray = cv2.cvtColor(use_image, cv2.COLOR_BGR2GRAY)

#Stadard values
min_val = 100
max_val = 200
# Apply Canny Edge Detection
edges = cv2.Canny(gray, min_val, max_val)
#edges = cv2.Canny(gray, min_val, max_val,apertureSize=5,L2gradient = True )
False
# Show the result
plt.figure(figsize=(15, 5))
plt.subplot(131), plt.imshow(cv2.cvtColor(use_image, cv2.COLOR_BGR2RGB))
plt.title('Original Image'), plt.axis('off')
plt.subplot(132), plt.imshow(gray, cmap='gray')
plt.title('Grayscale Image'), plt.axis('off')
plt.subplot(133), plt.imshow(edges, cmap='gray')
plt.title('Canny Edges'), plt.axis('off')
plt.show()

분할된 이미지에서는 고분과 주변 지역이 뚜렷한 색상으로 군집되어 있습니다. 그러나 노이즈와 색상의 작은 변화로 인해 클러스터가 조각화되어 해석이 어려울 수 있습니다.
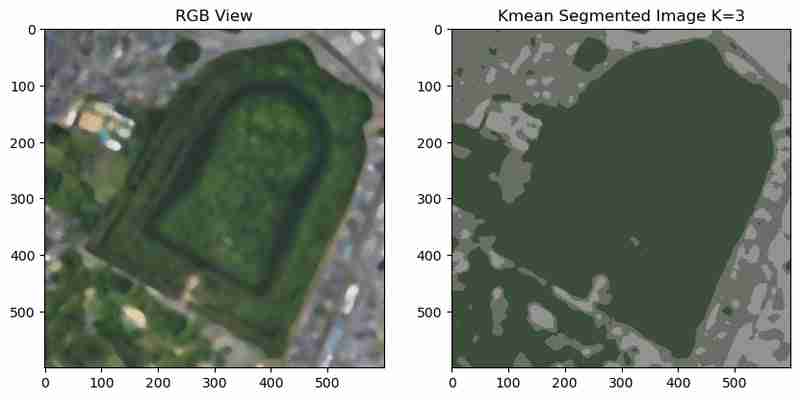
노이즈를 줄이고 더 부드러운 클러스터를 만들기 위해 K-평균을 실행하기 전에 중앙값 흐림을 적용할 수 있습니다.
use_image= img[0:600,700:1300]
gray = cv2.cvtColor(use_image, cv2.COLOR_BGR2GRAY)
gray_og = gray.copy()
gray = cv2.equalizeHist(gray)
gray = cv2.GaussianBlur(gray, (9, 9),1)

plt.figure(figsize=(15, 5))
plt.subplot(121), plt.imshow(gray, cmap='gray')
plt.title('Grayscale Image')
plt.subplot(122)
_= plt.hist(gray.ravel(), 256, [0,256],label="Equalized")
_ = plt.hist(gray_og.ravel(), 256, [0,256],label="Original",histtype='step')
plt.legend()
plt.title('Grayscale Histogram')

흐릿한 이미지로 인해 클러스터가 더 부드러워지고 노이즈가 줄어들며 분할된 영역이 시각적으로 더 응집력 있게 됩니다.
분할 결과를 더 잘 이해하기 위해 matplotlib plt.fill_between;을 사용하여 고유한 클러스터 색상의 색상 맵을 만들 수 있습니다.
# Edges to contours
contours, hierarchy = cv2.findContours(edges, cv2.RETR_TREE, cv2.CHAIN_APPROX_SIMPLE)
# Calculate contour areas
areas = [cv2.contourArea(contour) for contour in contours]

# Normalize areas for the colormap
normalized_areas = np.array(areas)
if normalized_areas.max() > 0:
    normalized_areas = normalized_areas / normalized_areas.max()

# Create a colormap
cmap = plt.cm.jet

# Plot the contours with the color map
plt.figure(figsize=(10, 10))
plt.subplot(1,2,1)
plt.imshow(gray, cmap='gray', alpha=0.5)  # Display the grayscale image in the background
mask = np.zeros_like(use_image)
for contour, norm_area in zip(contours, normalized_areas):
    color = cmap(norm_area)  # Map the normalized area to a color
    color = [int(c*255) for c in color[:3]]
    cv2.drawContours(mask, [contour], -1, color,-1 )  # Draw contours on the image

plt.subplot(1,2,2)

이 시각화는 이미지의 주요 색상과 해당 RGB 값에 대한 통찰력을 제공하므로 추가 분석에 유용할 수 있습니다. 이제 내 색상 코드를 마스크하고 영역을 선택할 수 있습니다.
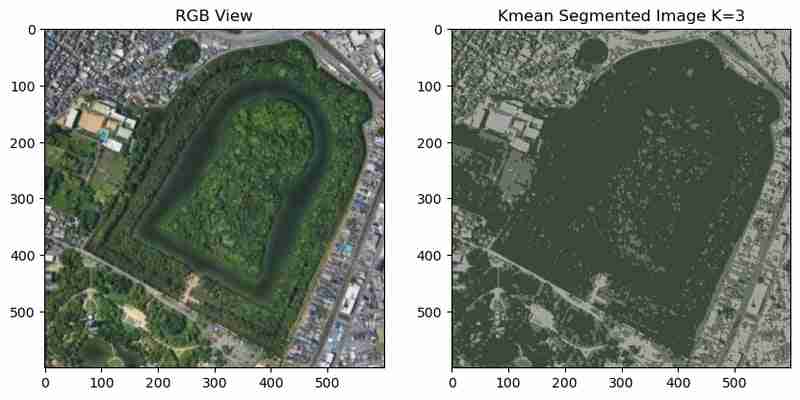
클러스터 수(K)는 결과에 큰 영향을 미칩니다. K를 늘리면 더욱 세부적인 분할이 생성되고, 값이 낮을수록 더 넓은 그룹화가 생성됩니다. 실험을 위해 여러 K 값을 반복할 수 있습니다.
import cv2
import numpy as np
import matplotlib.pyplot as plt
files = sorted(glob("SAT*.png")) #Get png files
print(len(files))
img=cv2.imread(files[0])
use_image= img[0:600,700:1300]
gray = cv2.cvtColor(use_image, cv2.COLOR_BGR2GRAY)

#Stadard values
min_val = 100
max_val = 200
# Apply Canny Edge Detection
edges = cv2.Canny(gray, min_val, max_val)
#edges = cv2.Canny(gray, min_val, max_val,apertureSize=5,L2gradient = True )
False
# Show the result
plt.figure(figsize=(15, 5))
plt.subplot(131), plt.imshow(cv2.cvtColor(use_image, cv2.COLOR_BGR2RGB))
plt.title('Original Image'), plt.axis('off')
plt.subplot(132), plt.imshow(gray, cmap='gray')
plt.title('Grayscale Image'), plt.axis('off')
plt.subplot(133), plt.imshow(edges, cmap='gray')
plt.title('Canny Edges'), plt.axis('off')
plt.show()

다양한 K 값에 대한 클러스터링 결과는 세부사항과 단순성 사이의 균형을 보여줍니다.
・낮은 K 값(예: 2-3): 명확한 구분이 있는 광범위한 클러스터로 상위 수준 분할에 적합합니다.
・K 값이 높을수록(예: 12-15): 더 세부적으로 세분화되지만 복잡성이 증가하고 과도하게 세분화될 가능성이 있습니다.
K-평균 클러스터링은 색상 유사성을 기준으로 이미지를 분할하는 강력한 기술입니다. 올바른 전처리 단계를 통해 명확하고 의미 있는 영역을 생성합니다. 그러나 성능은 K의 선택, 입력 이미지의 품질, 적용된 전처리에 따라 달라집니다. 다음으로 지형적 특징을 사용하여 객체와 지역을 정확하게 분할하는 유역 알고리즘을 살펴보겠습니다.
유역 분할
유역 알고리즘은 유역이 배수 유역을 나누는 지형도에서 영감을 받았습니다. 이 방법은 회색조 강도 값을 고도로 처리하여 "최고점"과 "골짜기"를 효과적으로 생성합니다. 관심 영역을 식별함으로써 알고리즘은 정확한 경계로 객체를 분할할 수 있습니다. 이는 겹치는 개체를 분리하는 데 특히 유용하므로 셀 분할, 개체 감지, 밀집된 특징 구별과 같은 복잡한 시나리오에 탁월한 선택입니다.
첫 번째 단계는 이미지를 전처리하여 특징을 강화한 다음 유역 알고리즘을 적용하는 것입니다.
use_image= img[0:600,700:1300]
gray = cv2.cvtColor(use_image, cv2.COLOR_BGR2GRAY)
gray_og = gray.copy()
gray = cv2.equalizeHist(gray)
gray = cv2.GaussianBlur(gray, (9, 9),1)

plt.figure(figsize=(15, 5))
plt.subplot(121), plt.imshow(gray, cmap='gray')
plt.title('Grayscale Image')
plt.subplot(122)
_= plt.hist(gray.ravel(), 256, [0,256],label="Equalized")
_ = plt.hist(gray_og.ravel(), 256, [0,256],label="Original",histtype='step')
plt.legend()
plt.title('Grayscale Histogram')
분할된 영역과 경계는 중간 처리 단계와 함께 시각화될 수 있습니다.

# Edges to contours
contours, hierarchy = cv2.findContours(edges, cv2.RETR_TREE, cv2.CHAIN_APPROX_SIMPLE)
# Calculate contour areas
areas = [cv2.contourArea(contour) for contour in contours]

# Normalize areas for the colormap
normalized_areas = np.array(areas)
if normalized_areas.max() > 0:
    normalized_areas = normalized_areas / normalized_areas.max()

# Create a colormap
cmap = plt.cm.jet

# Plot the contours with the color map
plt.figure(figsize=(10, 10))
plt.subplot(1,2,1)
plt.imshow(gray, cmap='gray', alpha=0.5)  # Display the grayscale image in the background
mask = np.zeros_like(use_image)
for contour, norm_area in zip(contours, normalized_areas):
    color = cmap(norm_area)  # Map the normalized area to a color
    color = [int(c*255) for c in color[:3]]
    cv2.drawContours(mask, [contour], -1, color,-1 )  # Draw contours on the image

plt.subplot(1,2,2)
알고리즘은 별개의 영역을 성공적으로 식별하고 객체 주위에 명확한 경계를 그립니다. 이 예에서는 고분 고분을 정확하게 분할했습니다. 그러나 알고리즘의 성능은 임계값 지정, 노이즈 제거, 형태학적 연산과 같은 전처리 단계에 크게 좌우됩니다.
히스토그램 균등화 또는 적응형 흐림 처리와 같은 고급 전처리를 추가하면 결과가 더욱 향상될 수 있습니다. 예를 들면 다음과 같습니다.
# Kmean color segmentation
use_image= img[0:600,700:1300]
#use_image = cv2.medianBlur(use_image, 15)


 # Reshape image for k-means
pixel_values = use_image.reshape((-1, 3)) if len(use_image.shape) == 3 else use_image.reshape((-1, 1))
pixel_values = np.float32(pixel_values)

criteria = (cv2.TERM_CRITERIA_EPS + cv2.TERM_CRITERIA_MAX_ITER, 10, 1.0)
K = 3
attempts=10
ret,label,center=cv2.kmeans(pixel_values,K,None,criteria,attempts,cv2.KMEANS_PP_CENTERS)

centers = np.uint8(center)
segmented_data = centers[label.flatten()]
segmented_image = segmented_data.reshape(use_image.shape)

plt.figure(figsize=(10, 6))
plt.subplot(1,2,1),plt.imshow(use_image[:,:,::-1])
plt.title("RGB View")
plt.subplot(1,2,2),plt.imshow(segmented_image[:,:,[2,1,0]])
plt.title(f"Kmean Segmented Image K={K}")

이러한 조정을 통해 더 많은 영역을 정확하게 분할하고 노이즈 아티팩트를 최소화할 수 있습니다.
유역 알고리즘은 정확한 경계 묘사와 겹치는 객체의 분리가 필요한 시나리오에 탁월합니다. 전처리 기술을 활용하여 고분 고분 지역과 같은 복잡한 이미지도 효과적으로 처리할 수 있습니다. 그러나 성공 여부는 신중한 매개변수 조정 및 전처리에 달려 있습니다.
결론
세분화는 이미지 분석의 필수 도구로, 이미지 내의 고유한 요소를 분리하고 이해할 수 있는 경로를 제공합니다. 이 튜토리얼에서는 캐니 에지 감지, K-평균 클러스터링, 유역 알고리즘이라는 세 가지 강력한 분할 기술을 시연했으며 각각 특정 애플리케이션에 맞게 조정되었습니다. 오사카의 고대 고분 고분 개요부터 도시 경관 클러스터링 및 개별 지역 분리에 이르기까지 이러한 방법은 실제 문제를 해결하는 OpenCV의 다양성을 강조합니다.
이제 선택한 애플리케이션에 몇 가지 방법을 적용하고 댓글을 달고 결과를 공유해 보세요. 또한 다른 간단한 분할 방법을 알고 계시다면 공유해주세요
위 내용은 [Python-CV이미지 분할 : Canny Edge, Watershed 및 K-Means 방법의 상세 내용입니다. 자세한 내용은 PHP 중국어 웹사이트의 기타 관련 기사를 참조하세요!

