PyPlot 및 Scipy를 사용하여 Python에서 선 플롯을 매끄럽게 만드는 방법은 무엇입니까?
- Susan Sarandon원래의
- 2024-11-02 16:04:02586검색
PyPlot을 사용하여 선 그림 평활화
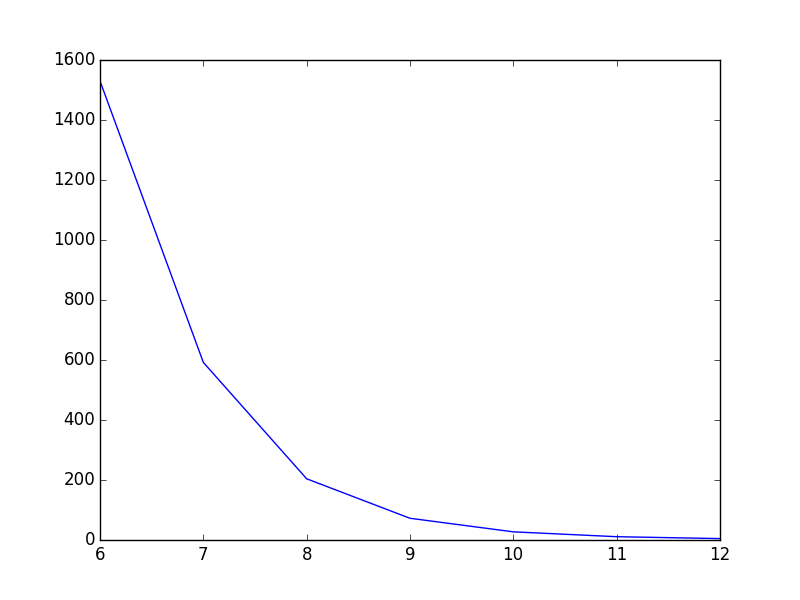
PyPlot의 기본 선 그림 방법은 데이터 점을 직선으로 연결합니다. 이 접근 방식은 특히 대규모 데이터 세트를 처리할 때 들쭉날쭉한 선을 초래할 수 있습니다. 다행히 scipy.interpolate.spline을 사용하여 이러한 선을 매끄럽게 만드는 쉬운 방법이 있습니다.
<code class="python"># Import necessary libraries
import matplotlib.pyplot as plt
import numpy as np
from scipy.interpolate import spline

# Define data arrays
T = np.array([6, 7, 8, 9, 10, 11, 12])
power = np.array([1.53E+03, 5.92E+02, 2.04E+02, 7.24E+01, 2.72E+01, 1.10E+01, 4.70E+00])

# Generate a smoothed spline
xnew = np.linspace(T.min(), T.max(), 300)
power_smooth = spline(T, power, xnew)

# Plot the smoothed line
plt.plot(xnew, power_smooth)
plt.show()</code>
매끄럽게 하기 전:
스무딩 후:
또는 scipy.interpolate.make_interp_spline의 BSpline을 사용하여 보다 현대적인 접근 방식을 사용할 수 있습니다.
<code class="python"># Import make_interp_spline and BSpline
from scipy.interpolate import make_interp_spline, BSpline

# Generate a smoothed spline using BSpline
spl = make_interp_spline(T, power, k=3)
power_smooth = spl(xnew)

# Plot the smoothed line
plt.plot(xnew, power_smooth)
plt.show()</code>
위 내용은 PyPlot 및 Scipy를 사용하여 Python에서 선 플롯을 매끄럽게 만드는 방법은 무엇입니까?의 상세 내용입니다. 자세한 내용은 PHP 중국어 웹사이트의 기타 관련 기사를 참조하세요!
성명:
본 글의 내용은 네티즌들의 자발적인 기여로 작성되었으며, 저작권은 원저작자에게 있습니다. 본 사이트는 이에 상응하는 법적 책임을 지지 않습니다. 표절이나 침해가 의심되는 콘텐츠를 발견한 경우 admin@php.cn으로 문의하세요.

