


소개
Snowflake에서는 Snowflake Copilot이라는 LLM 보조 기능을 미리보기 기능으로 출시했습니다. Snowflake Copilot을 사용하면 자연어를 활용하여 테이블 데이터를 분석할 수 있습니다.
반면에 Streamlit in Snowflake(SiS)를 사용하면 생성 AI를 쉽게 통합하고 테이블 데이터에 안전하게 액세스할 수 있습니다. 이로 인해 저는 다음과 같은 생각을 하게 되었습니다. 보다 적극적인 자연어 데이터 분석 도구를 만들 수는 없을까? 그래서 자연어를 활용하여 데이터를 분석하고 시각화할 수 있는 앱을 개발했습니다.
참고: 이 게시물은 Snowflake의 의견이 아닌 개인적인 견해를 나타냅니다.
기능 개요
목표
- SQL에 익숙하지 않은 비즈니스 사용자도 사용 가능
- 마우스 조작을 통해 DB/스키마/테이블을 선택하여 분석하는 기능
- 매우 모호한 자연어 쿼리로 분석 가능
실제 스크린샷(발췌)
다음은 Cortex LLM(snowflake-arctic)을 이용한 분석 결과를 발췌한 것입니다.

참고: 이 와인 품질 데이터세트를 사용했습니다.
기능 목록
- 분석을 위해 Cortex LLM을 선택하세요
- 분석할 DB/스키마/테이블 선택
- 선택한 테이블의 컬럼 정보와 샘플 데이터 표시
- 사용자의 자연어 입력을 이용한 분석
- 분석을 위한 자동 SQL 생성
- 생성된 SQL 자동 실행
- SQL 쿼리 실행 결과 표시
- Cortex LLM에서 제공하는 데이터 인사이트
- 데이터 시각화
- Cortex LLM을 통한 적절한 그래프 선택 및 표시
- Cortex LLM을 통한 최종 데이터 해석
작동 조건
- Cortex LLM에 액세스할 수 있는 Snowflake 계정
- snowflake-ml-python 1.1.2 이상
지침
- 데이터 제한이 설정되어 있지 않으므로 대규모 데이터세트를 사용할 때는 주의하세요.
- 생성된 SQL 쿼리의 대규모 결과 세트를 처리하는 데 시간이 걸릴 수 있습니다
- 큰 결과 세트로 인해 LLM 토큰 제한 오류가 발생할 수 있습니다
소스 코드
from snowflake.snowpark.context import get_active_session
import streamlit as st
from snowflake.cortex import Complete as CompleteText
import snowflake.snowpark.functions as F
import pandas as pd
import numpy as np
import json
import plotly.express as px
# Get current session
session = get_active_session()
# Application title
st.title("Natural Language Data Analysis App")
# Cortex LLM settings
st.sidebar.title("Cortex LLM Settings")
lang_model = st.sidebar.radio("Select the language model you want to use",
("snowflake-arctic", "reka-flash", "reka-core",
"mistral-large2", "mistral-large", "mixtral-8x7b", "mistral-7b",
"llama3.1-405b", "llama3.1-70b", "llama3.1-8b",
"llama3-70b", "llama3-8b", "llama2-70b-chat",
"jamba-instruct", "gemma-7b")
)
# Function to escape column names
def escape_column_name(name):
return f'"{name}"'
# Function to get table information
def get_table_info(database, schema, table):
# Get column information
columns = session.sql(f"DESCRIBE TABLE {database}.{schema}.{table}").collect()
# Create DataFrame
column_df = pd.DataFrame(columns)
# Get row count
row_count = session.sql(f"SELECT COUNT(*) as count FROM {database}.{schema}.{table}").collect()[0]['COUNT']
# Get sample data
sample_data = session.sql(f"SELECT * FROM {database}.{schema}.{table} LIMIT 5").collect()
sample_df = pd.DataFrame(sample_data)
return column_df, row_count, sample_df
# Data analysis function
def analyze(df, query):
st.subheader("Result Analysis")
# Display basic statistical information
st.subheader("Basic Statistics")
st.write(df.describe())
# Use AI for data analysis
analysis_prompt = f"""
Based on the following dataframe and original question, please perform data analysis.
Concisely explain in English the insights, trends, and anomalies derived from the data.
If possible, please also mention the following points:
1. Data distribution and characteristics
2. Presence of abnormal values or outliers
3. Correlations between columns (if there are multiple numeric columns)
4. Time-series trends (if there is date or time data)
5. Category-specific features (if data can be divided by categories)
Dataframe:
{df.to_string()}
Original question:
{query}
"""
analysis = CompleteText(lang_model, analysis_prompt)
st.write(analysis)
# Data visualization function
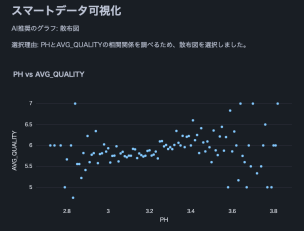
def smart_data_visualization(df):
st.subheader("Smart Data Visualization")
if df.empty:
st.warning("The dataframe is empty. There is no data to visualize.")
return
# Request AI for graph suggestion
columns_info = "\n".join([f"{col} - type: {df[col].dtype}" for col in df.columns])
sample_data = df.head().to_string()
visualization_prompt = f"""
Analyze the information of the following dataframe and suggest the most appropriate graph type and the columns to use for its x-axis and y-axis.
Consider the characteristics of the data to ensure a meaningful visualization.
Column information:
{columns_info}
Sample data:
{sample_data}
Please provide only the following JSON data format as your response:
{{
"graph_type": "One of: scatter plot, bar chart, line chart, histogram, box plot",
"x_axis": "Column name to use for x-axis",
"y_axis": "Column name to use for y-axis (if applicable)",
"explanation": "Brief explanation of the selection reason"
}}
"""
ai_suggestion = CompleteText(lang_model, visualization_prompt)
try:
suggestion = json.loads(ai_suggestion)
graph_type = suggestion['graph_type']
x_axis = suggestion['x_axis']
y_axis = suggestion.get('y_axis') # y-axis might not be needed in some cases
explanation = suggestion['explanation']
st.write(f"AI recommended graph: {graph_type}")
st.write(f"Selection reason: {explanation}")
if graph_type == "scatter plot":
fig = px.scatter(df, x=x_axis, y=y_axis, title=f"{x_axis} vs {y_axis}")
elif graph_type == "bar chart":
fig = px.bar(df, x=x_axis, y=y_axis, title=f"{y_axis} by {x_axis}")
elif graph_type == "line chart":
fig = px.line(df, x=x_axis, y=y_axis, title=f"{y_axis} over {x_axis}")
elif graph_type == "histogram":
fig = px.histogram(df, x=x_axis, title=f"Distribution of {x_axis}")
elif graph_type == "box plot":
fig = px.box(df, x=x_axis, y=y_axis, title=f"Distribution of {y_axis} by {x_axis}")
else:
st.warning(f"Unsupported graph type: {graph_type}")
return
st.plotly_chart(fig)
except json.JSONDecodeError:
st.error("Failed to parse AI suggestion. Please try again.")
except KeyError as e:
st.error(f"AI suggestion is missing necessary information: {str(e)}")
except Exception as e:
st.error(f"An error occurred while creating the graph: {str(e)}")
# AI interpretation of visualization
visualization_interpretation_prompt = f"""
Based on the following dataset and created graph, please provide a detailed interpretation of the data trends and characteristics in English.
Point out possible insights, patterns, anomalies, or areas that require additional analysis.
Dataset information:
Columns: {', '.join(df.columns)}
Number of rows: {len(df)}
Created graph:
Type: {graph_type}
X-axis: {x_axis}
Y-axis: {y_axis if y_axis else 'None'}
"""
ai_interpretation = CompleteText(lang_model, visualization_interpretation_prompt)
st.subheader("AI Interpretation of the Graph")
st.write(ai_interpretation)
# Function to handle cases where AI response is not just SQL query
def clean_sql_query(query):
# Remove leading and trailing whitespace
query = query.strip()
# If not starting with SQL keywords, remove everything up to the first SELECT
if not query.upper().startswith(('SELECT')):
keywords = ['SELECT']
for keyword in keywords:
if keyword in query.upper():
query = query[query.upper().index(keyword):]
break
return query
# Function for natural language querying of DB
def data_analysis_and_natural_language_query():
# Database selection
databases = session.sql("SHOW DATABASES").collect()
database_names = [row['name'] for row in databases]
selected_database = st.selectbox("Select a database", database_names)
if selected_database:
# Schema selection
schemas = session.sql(f"SHOW SCHEMAS IN DATABASE {selected_database}").collect()
schema_names = [row['name'] for row in schemas]
selected_schema = st.selectbox("Select a schema", schema_names)
if selected_schema:
# Table selection
tables = session.sql(f"SHOW TABLES IN {selected_database}.{selected_schema}").collect()
table_names = [row['name'] for row in tables]
selected_table = st.selectbox("Select a table", table_names)
if selected_table:
# Get table information
column_df, row_count, sample_df = get_table_info(selected_database, selected_schema, selected_table)
st.subheader("Table Information")
st.write(f"Table name: `{selected_database}.{selected_schema}.{selected_table}`")
st.write(f"Total rows: **{row_count:,}**")
st.subheader("Column Information")
st.dataframe(column_df)
st.subheader("Sample Data (showing only 5 rows)")
st.dataframe(sample_df)
# Stringify table information (for AI)
table_info = f"""
Table name: {selected_database}.{selected_schema}.{selected_table}
Total rows: {row_count}
Column information:
{column_df.to_string(index=False)}
Sample data:
{sample_df.to_string(index=False)}
"""
# Natural language input from user
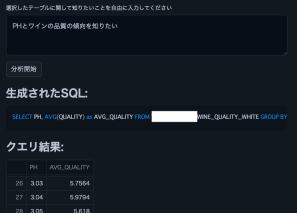
user_query = st.text_area("Enter what you want to know about the selected table")
if st.button("Start Analysis"):
if user_query:
# Use AI to generate SQL
prompt = f"""
Based on the following table information and question, please generate an appropriate SQL query.
Return only the generated SQL query without any additional response.
Table information:
{table_info}
Question: {user_query}
Notes:
- Follow Snowflake SQL syntax.
- Use aggregate functions to keep the query result size manageable.
- Use {selected_database}.{selected_schema}.{selected_table} as the table name.
"""
generated_sql = CompleteText(lang_model, prompt)
generated_sql = clean_sql_query(generated_sql)
st.subheader("Generated SQL:")
st.code(generated_sql, language='sql')
try:
# Execute the generated SQL
result = session.sql(generated_sql).collect()
df = pd.DataFrame(result)
st.subheader("Query Result:")
st.dataframe(df)
# Analyze results
analyze(df, user_query)
# Smart data visualization
smart_data_visualization(df)
except Exception as e:
st.error(f"An error occurred while executing the query: {str(e)}")
else:
st.warning("Please enter a question.")
# Execution part
data_analysis_and_natural_language_query()
결론
SQL이나 Python 지식 없이도 자연어를 사용하여 테이블 데이터를 쉽게 분석할 수 있다면 기업 사용자의 데이터 활용 범위가 크게 넓어질 수 있습니다. 여러 테이블을 조인하거나 시각화 그래프의 다양성을 늘리는 등의 기능을 추가하면 더욱 복잡한 분석을 수행할 수 있습니다. Snowflake에서 Streamlit을 사용하여 데이터 분석 민주화를 구현해 보시기 바랍니다.
공지사항
X의 Snowflake 새로운 기능 업데이트
Snowflake의 X에 대한 새로운 소식을 공유하고 있습니다. 관심이 있으시면 언제든지 팔로우해주세요!
영어 버전
Snowflake What's New Bot(영어 버전)
https://x.com/snow_new_en
일본어 버전
Snowflake What's New Bot(일본어 버전)
https://x.com/snow_new_jp
변경 내역
(20240914) 첫글
일본어 원본 기사
https://zenn.dev/tsubasa_tech/articles/2608c820294860
위 내용은 Snowflake(SiS)의 Streamlit을 사용하여 자연어 데이터 분석을 사용해 보세요.의 상세 내용입니다. 자세한 내용은 PHP 중국어 웹사이트의 기타 관련 기사를 참조하세요!

 파이썬과 시간 : 공부 시간을 최대한 활용Apr 14, 2025 am 12:02 AM
제한된 시간에 Python 학습 효율을 극대화하려면 Python의 DateTime, Time 및 Schedule 모듈을 사용할 수 있습니다. 1. DateTime 모듈은 학습 시간을 기록하고 계획하는 데 사용됩니다. 2. 시간 모듈은 학습과 휴식 시간을 설정하는 데 도움이됩니다. 3. 일정 모듈은 주간 학습 작업을 자동으로 배열합니다.
 파이썬 : 게임, Guis 등Apr 13, 2025 am 12:14 AM
Python은 게임 및 GUI 개발에서 탁월합니다. 1) 게임 개발은 Pygame을 사용하여 드로잉, 오디오 및 기타 기능을 제공하며 2D 게임을 만드는 데 적합합니다. 2) GUI 개발은 Tkinter 또는 PYQT를 선택할 수 있습니다. Tkinter는 간단하고 사용하기 쉽고 PYQT는 풍부한 기능을 가지고 있으며 전문 개발에 적합합니다.
 Python vs. C : 응용 및 사용 사례가 비교되었습니다Apr 12, 2025 am 12:01 AM
Python은 데이터 과학, 웹 개발 및 자동화 작업에 적합한 반면 C는 시스템 프로그래밍, 게임 개발 및 임베디드 시스템에 적합합니다. Python은 단순성과 강력한 생태계로 유명하며 C는 고성능 및 기본 제어 기능으로 유명합니다.
 2 시간의 파이썬 계획 : 현실적인 접근Apr 11, 2025 am 12:04 AM
2 시간 이내에 Python의 기본 프로그래밍 개념과 기술을 배울 수 있습니다. 1. 변수 및 데이터 유형을 배우기, 2. 마스터 제어 흐름 (조건부 명세서 및 루프), 3. 기능의 정의 및 사용을 이해하십시오. 4. 간단한 예제 및 코드 스 니펫을 통해 Python 프로그래밍을 신속하게 시작하십시오.
 파이썬 : 기본 응용 프로그램 탐색Apr 10, 2025 am 09:41 AM
Python은 웹 개발, 데이터 과학, 기계 학습, 자동화 및 스크립팅 분야에서 널리 사용됩니다. 1) 웹 개발에서 Django 및 Flask 프레임 워크는 개발 프로세스를 단순화합니다. 2) 데이터 과학 및 기계 학습 분야에서 Numpy, Pandas, Scikit-Learn 및 Tensorflow 라이브러리는 강력한 지원을 제공합니다. 3) 자동화 및 스크립팅 측면에서 Python은 자동화 된 테스트 및 시스템 관리와 같은 작업에 적합합니다.
 2 시간 안에 얼마나 많은 파이썬을 배울 수 있습니까?Apr 09, 2025 pm 04:33 PM
2 시간 이내에 파이썬의 기본 사항을 배울 수 있습니다. 1. 변수 및 데이터 유형을 배우십시오. 이를 통해 간단한 파이썬 프로그램 작성을 시작하는 데 도움이됩니다.
 10 시간 이내에 프로젝트 및 문제 중심 방법에서 컴퓨터 초보자 프로그래밍 기본 사항을 가르치는 방법?Apr 02, 2025 am 07:18 AM
10 시간 이내에 컴퓨터 초보자 프로그래밍 기본 사항을 가르치는 방법은 무엇입니까? 컴퓨터 초보자에게 프로그래밍 지식을 가르치는 데 10 시간 밖에 걸리지 않는다면 무엇을 가르치기로 선택 하시겠습니까?
 중간 독서를 위해 Fiddler를 사용할 때 브라우저에서 감지되는 것을 피하는 방법은 무엇입니까?Apr 02, 2025 am 07:15 AM
Fiddlerevery Where를 사용할 때 Man-in-the-Middle Reading에 Fiddlereverywhere를 사용할 때 감지되는 방법 ...


핫 AI 도구

Undresser.AI Undress
사실적인 누드 사진을 만들기 위한 AI 기반 앱

AI Clothes Remover
사진에서 옷을 제거하는 온라인 AI 도구입니다.

Undress AI Tool
무료로 이미지를 벗다

Clothoff.io
AI 옷 제거제

AI Hentai Generator
AI Hentai를 무료로 생성하십시오.

인기 기사
뜨거운 도구

DVWA
DVWA(Damn Vulnerable Web App)는 매우 취약한 PHP/MySQL 웹 애플리케이션입니다. 주요 목표는 보안 전문가가 법적 환경에서 자신의 기술과 도구를 테스트하고, 웹 개발자가 웹 응용 프로그램 보안 프로세스를 더 잘 이해할 수 있도록 돕고, 교사/학생이 교실 환경 웹 응용 프로그램에서 가르치고 배울 수 있도록 돕는 것입니다. 보안. DVWA의 목표는 다양한 난이도의 간단하고 간단한 인터페이스를 통해 가장 일반적인 웹 취약점 중 일부를 연습하는 것입니다. 이 소프트웨어는

에디트플러스 중국어 크랙 버전
작은 크기, 구문 강조, 코드 프롬프트 기능을 지원하지 않음

드림위버 CS6
시각적 웹 개발 도구

맨티스BT
Mantis는 제품 결함 추적을 돕기 위해 설계된 배포하기 쉬운 웹 기반 결함 추적 도구입니다. PHP, MySQL 및 웹 서버가 필요합니다. 데모 및 호스팅 서비스를 확인해 보세요.

안전한 시험 브라우저
안전한 시험 브라우저는 온라인 시험을 안전하게 치르기 위한 보안 브라우저 환경입니다. 이 소프트웨어는 모든 컴퓨터를 안전한 워크스테이션으로 바꿔줍니다. 이는 모든 유틸리티에 대한 액세스를 제어하고 학생들이 승인되지 않은 리소스를 사용하는 것을 방지합니다.

