Adaptive Analytics 솔루션으로 AI/ML 연결
- DDD원래의
- 2024-09-13 06:27:07818검색
오늘날의 데이터 환경에서 기업은 다양한 과제에 직면하고 있습니다. 그 중 하나는 모든 소비자가 사용할 수 있는 통합되고 조화된 데이터 계층을 기반으로 분석을 수행하는 것입니다. 사용하는 방언이나 도구에 관계없이 동일한 질문에 대해 동일한 답변을 전달할 수 있는 레이어입니다.
InterSystems IRIS 데이터 플랫폼은 통합된 의미 계층을 제공할 수 있는 Adaptive Analytics의 추가 기능으로 이에 답합니다. DevCommunity에는 BI 도구를 통해 사용하는 방법에 대한 많은 기사가 있습니다. 이번 글에서는 AI로 이를 소비하는 방법과 인사이트를 되살리는 방법에 대한 부분을 다룰 것입니다.
한걸음씩 나아가자...
적응형 분석이란 무엇입니까?
개발자 커뮤니티 웹사이트에서 일부 정의를 쉽게 찾을 수 있습니다
간단히 말해서, 추가 소비 및 분석을 위해 선택한 다양한 도구에 구조화되고 조화된 형태로 데이터를 전달할 수 있습니다. 다양한 BI 도구에 동일한 데이터 구조를 제공합니다. 하지만... AI/ML 도구에 동일한 데이터 구조를 제공할 수도 있습니다!
Adaptive Analytics에는 AI에서 BI로의 연결을 구축하는 AI-Link라는 추가 구성 요소가 있습니다.
AI-Link란 정확히 무엇인가요?
기계 학습(ML) 워크플로(예: 기능 엔지니어링)의 주요 단계를 간소화하기 위해 의미 계층과 프로그래밍 방식으로 상호 작용할 수 있도록 설계된 Python 구성 요소입니다.
AI-Link를 사용하면 다음을 수행할 수 있습니다.
- 프로그래밍 방식으로 분석 데이터 모델의 기능에 액세스합니다.
- 쿼리 작성, 차원 및 측정값 탐색
- ML 파이프라인에 피드를 제공합니다. ...그리고 다른 사람이 다시 사용할 수 있도록 결과를 의미 체계 계층으로 다시 전달합니다(예: Tableau 또는 Excel을 통해).
Python 라이브러리이므로 어떤 Python 환경에서도 사용할 수 있습니다. 노트북도 포함됩니다.
이 기사에서는 AI-Link의 도움으로 Jupyter Notebook에서 Adaptive Analytics 솔루션에 도달하는 간단한 예를 제시하겠습니다.
다음은 완전한 노트북을 포함하는 git 저장소입니다: https://github.com/v23ent/aa-hands-on
전제조건
다음 단계에서는 다음 전제 조건이 완료되었다고 가정합니다.
- 적응형 분석 솔루션 실행 중(IRIS 데이터 플랫폼을 데이터 웨어하우스로 사용)
- Jupyter Notebook 실행 중
- 1.과 2.의 연결이 가능합니다
1단계: 설정
먼저 우리 환경에 필요한 구성요소를 설치해 보겠습니다. 그러면 추가 단계 작업에 필요한 몇 가지 패키지가 다운로드됩니다.
'atscale' - 연결을 위한 주요 패키지입니다
'선지자' - 예측에 필요한 패키지
pip install atscale prophet
그런 다음 의미 계층의 일부 주요 개념을 나타내는 주요 클래스를 가져와야 합니다.
클라이언트 - Adaptive Analytics에 대한 연결을 설정하는 데 사용할 클래스입니다.
프로젝트 - Adaptive Analytics 내부의 프로젝트를 나타내는 클래스입니다.
DataModel - 가상 큐브를 나타내는 클래스
from atscale.client import Client
from atscale.data_model import DataModel
from atscale.project import Project
from prophet import Prophet
import pandas as pd
2단계: 연결
이제 데이터 소스에 대한 연결 설정이 모두 완료되었습니다.
client = Client(server='http://adaptive.analytics.server', username='sample')
client.connect()
Adaptive Analytics 인스턴스의 연결 세부 정보를 지정하세요. 대화 상자에서 조직의 응답을 묻는 메시지가 나타나면 AtScale 인스턴스에서 비밀번호를 입력하세요.
연결이 설정되면 서버에 게시된 프로젝트 목록에서 프로젝트를 선택해야 합니다. 대화형 프롬프트로 프로젝트 목록이 표시되며 대답은 프로젝트의 정수 ID여야 합니다. 그리고 데이터 모델이 유일한 경우 자동으로 선택됩니다.
project = client.select_project()
data_model = project.select_data_model()
3단계: 데이터 세트 탐색
AI-Link 컴포넌트 라이브러리에는 AtScale에서 준비한 여러 메소드가 있습니다. 보유한 데이터 카탈로그를 탐색하고, 데이터를 쿼리하고, 일부 데이터를 다시 수집할 수도 있습니다. AtScale 문서에는 사용 가능한 모든 것을 설명하는 광범위한 API 참조가 있습니다.
먼저 data_model의 몇 가지 메소드를 호출하여 데이터 세트가 무엇인지 살펴보겠습니다.
data_model.get_features()
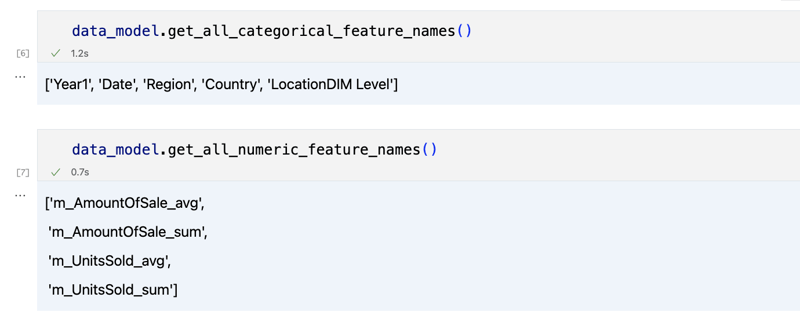
data_model.get_all_categorical_feature_names()
data_model.get_all_numeric_feature_names()
출력은 다음과 같아야 합니다

조금 둘러본 후 'get_data' 메소드를 사용하여 관심 있는 실제 데이터를 쿼리할 수 있습니다. 쿼리 결과가 포함된 Pandas DataFrame이 반환됩니다.
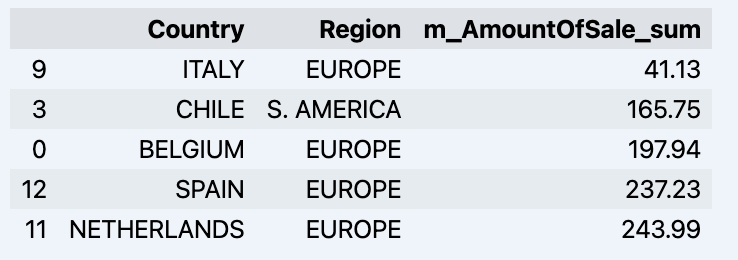
df = data_model.get_data(feature_list = ['Country','Region','m_AmountOfSale_sum'])
df = df.sort_values(by='m_AmountOfSale_sum')
df.head()
귀하의 데이터드램이 표시되는 항목:

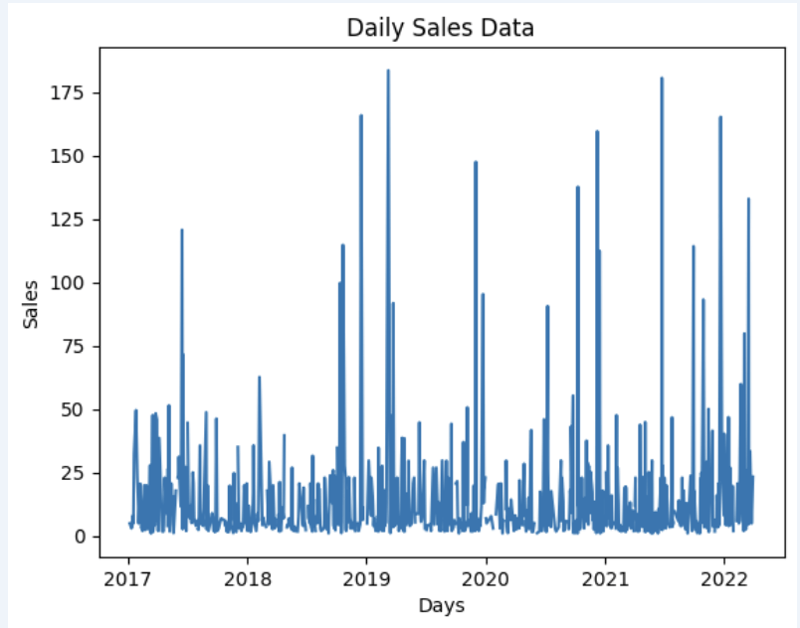
데이터세트를 준비해서 빠르게 그래프로 보여드리겠습니다
import matplotlib.pyplot as plt

# We're taking sales for each date
dataframe = data_model.get_data(feature_list = ['Date','m_AmountOfSale_sum'])

# Create a line chart
plt.plot(dataframe['Date'], dataframe['m_AmountOfSale_sum'])

# Add labels and a title
plt.xlabel('Days')
plt.ylabel('Sales')
plt.title('Daily Sales Data')

# Display the chart
plt.show()
출력:

Step 4: Prediction
The next step would be to actually get some value out of AI-Link bridge - let's do some simple prediction!
# Load the historical data to train the model
data_train = data_model.get_data(
    feature_list = ['Date','m_AmountOfSale_sum'],
    filter_less = {'Date':'2021-01-01'}
    )
data_test = data_model.get_data(
    feature_list = ['Date','m_AmountOfSale_sum'],
    filter_greater = {'Date':'2021-01-01'}
    )
We get 2 different datasets here: to train our model and to test it.
# For the tool we've chosen to do the prediction 'Prophet', we'll need to specify 2 columns: 'ds' and 'y'
data_train['ds'] = pd.to_datetime(data_train['Date'])
data_train.rename(columns={'m_AmountOfSale_sum': 'y'}, inplace=True)
data_test['ds'] = pd.to_datetime(data_test['Date'])
data_test.rename(columns={'m_AmountOfSale_sum': 'y'}, inplace=True)

# Initialize and fit the Prophet model
model = Prophet()
model.fit(data_train)
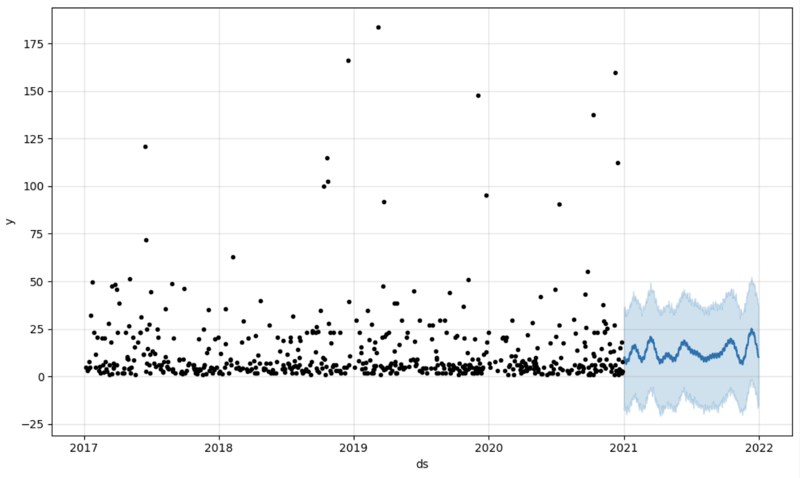
And then we create another dataframe to accomodate our prediction and display it on the graph
# Create a future dataframe for forecasting
future = pd.DataFrame()
future['ds'] = pd.date_range(start='2021-01-01', end='2021-12-31', freq='D')

# Make predictions
forecast = model.predict(future)
fig = model.plot(forecast)
fig.show()
Output:

Step 5: Writeback
Once we've got our prediction in place we can then put it back to the data warehouse and add an aggregate to our semantic model to reflect it for other consumers. The prediction would be available through any other BI tool for BI analysts and business users.
The prediction itself will be placed into our data warehouse and stored there.
from atscale.db.connections import Iris<br>
db = Iris(<br>
    username,<br>
    host,<br>
    namespace,<br>
    driver,<br>
    schema, <br>
    port=1972,<br>
    password=None, <br>
    warehouse_id=None<br>
    )

<p>data_model.writeback(dbconn=db,<br>
                    table_name= 'SalesPrediction',<br>
                    DataFrame = forecast)</p>

<p>data_model.create_aggregate_feature(dataset_name='SalesPrediction',<br>
                                    column_name='SalesForecasted',<br>
                                    name='sum_sales_forecasted',<br>
                                    aggregation_type='SUM')<br>
</p>
Fin
That is it!
Good luck with your predictions!
위 내용은 Adaptive Analytics 솔루션으로 AI/ML 연결의 상세 내용입니다. 자세한 내용은 PHP 중국어 웹사이트의 기타 관련 기사를 참조하세요!

