고양이와 개와 파이썬의 방출 CO
- WBOYWBOYWBOYWBOYWBOYWBOYWBOYWBOYWBOYWBOYWBOYWBOYWB원래의
- 2024-09-03 10:40:45429검색
안녕하세요
반려동물 배출에 관해 이야기하는 작은 기사를 발견해서 CO2 배출이 없으면 표시하기로 했습니다.
코드 :
https://github.com/victordalet/Kaggle_analytic/tree/feat/dog_co2
출처:
https://www.lekaba.fr/article/l-empreinte-carbone-des-chiens-et-des-chats-un-amour-qui-pese-lourd-sur-le-climat
https://www.umweltbundesamt.de/en/image/global-f-gas-emissions-up-to-2050-total
https://www.rover.com/fr/blog/combien-y-a-t-il-de-chats-dans-le-monde/
나 - 데이터 가져오기
먼저 전 세계 CO2 소비량, 개와 고양이의 평균 배출량, 반려동물의 수를 추정한 데이터를 얻습니다.
import plotly.express as px


class Main:
    def __init__(self):
        self.estimation = {
            "2005": 750,
            "2010": 900,
            "2020": 1300,
            "2030": 1800,
            "2040": 2700,
            "2050": 4000,
        }

        self.estimation_no_cat = {
            "2005": 750,
            "2010": 900,
            "2020": 1300,
            "2030": 1800,
            "2040": 2700,
            "2050": 4000,
        }

        self.estimation_no_dog = {
            "2005": 750,
            "2010": 900,
            "2020": 1300,
            "2030": 1800,
            "2040": 2700,
            "2050": 4000,
        }

        self.estimation_no_cat_and_dog = {
            "2005": 750,
            "2010": 900,
            "2020": 1300,
            "2030": 1800,
            "2040": 2700,
            "2050": 4000,
        }

        self.cat_emission = 240
        self.dog_emission = 358
        self.nb_cats = 600000000
        self.nb_dogs = 900000000
II - 변환
총 배출량이 수백만 톤이므로 동물 데이터를 kg 단위로 변환하는 방법을 만들었습니다.
    @staticmethod
    def transform_to_million_of_tonnes(value):
        return value / (1000000 * 1000)
III - 계산
고양이나 개가 없는 추정치를 수정하려면 첫 번째 추정을 진행하고 다른 사전의 값을 첫 번째 단계에서 찾은 값으로 바꾸세요.
    def calculate(self):
        for year, value in self.estimation.items():
            self.estimation_no_cat[year] = value - self.transform_to_million_of_tonnes(
                self.cat_emission * self.nb_cats
            )
            self.estimation_no_dog[year] = value - self.transform_to_million_of_tonnes(
                self.dog_emission * self.nb_dogs
            )
            self.estimation_no_cat_and_dog[year] = (
                value
                - self.transform_to_million_of_tonnes(self.cat_emission * self.nb_cats)
                - self.transform_to_million_of_tonnes(self.dog_emission * self.nb_dogs)
            )
IV - 결과 표시
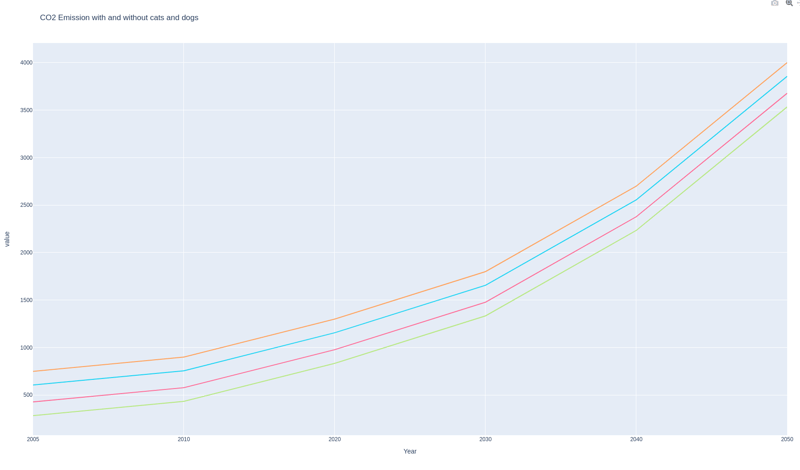
모든 데이터를 그래프로 표시하기 위해 Plotly 라이브러리를 사용합니다.
pip 설치 코드 :
pip install plotly
세 가지 추정치를 표시하는 코드:
    def display(self):
        fig = px.line(
            x=list(self.estimation.keys()),
            y=[
                list(self.estimation.values()),
                list(self.estimation_no_cat.values()),
                list(self.estimation_no_dog.values()),
                list(self.estimation_no_cat_and_dog.values()),
            ],
            labels={
                "x": "Year",
                "y": "CO2 Emission (in million of tonnes)",
                "color": "Legend",
            },
            title="CO2 Emission with and without cats and dogs",
            color_discrete_map={
                "CO2 Emission": "blue",
                "CO2 Emission without cats": "green",
                "CO2 Emission without dogs": "red",
                "CO2 Emission without cats and dogs": "orange",
            },
        )
        fig.show()
이제 결과가 포함된 차트가 생겼습니다.

위 내용은 고양이와 개와 파이썬의 방출 CO의 상세 내용입니다. 자세한 내용은 PHP 중국어 웹사이트의 기타 관련 기사를 참조하세요!
성명:
본 글의 내용은 네티즌들의 자발적인 기여로 작성되었으며, 저작권은 원저작자에게 있습니다. 본 사이트는 이에 상응하는 법적 책임을 지지 않습니다. 표절이나 침해가 의심되는 콘텐츠를 발견한 경우 admin@php.cn으로 문의하세요.
이전 기사:itertool 발견다음 기사:itertool 발견

