
AppSignal을 사용하여 Python Django 앱 성능 모니터링

- WBOYWBOYWBOYWBOYWBOYWBOYWBOYWBOYWBOYWBOYWBOYWBOYWB원래의
- 2024-08-14 20:37:08533검색
느린 시스템을 관찰하면 가장 먼저 본능적으로 실패라는 라벨을 붙일 수 있습니다. 이러한 가정은 널리 퍼져 있으며 근본적인 진실을 강조합니다. 성능은 애플리케이션의 성숙도 및 생산 준비 상태와 동의어입니다.
밀리초가 사용자 상호 작용의 성공 또는 실패를 결정할 수 있는 웹 애플리케이션에서는 위험이 엄청나게 높습니다. 성능은 단순한 기술 벤치마크가 아니라 사용자 만족도와 운영 효율성의 초석입니다.
성능은 CPU 및 메모리 사용률, 응답 시간, 확장성, 처리량 등의 지표로 정량화하여 다양한 워크로드에서 시스템의 응답성을 요약합니다.
이 기사에서는 AppSignal이 어떻게 Django 애플리케이션의 성능을 모니터링하고 향상시킬 수 있는지 살펴보겠습니다.
시작해 보세요!
Django 성능 모니터링 필수사항
Django 애플리케이션에서 최적의 성능을 달성하려면 다각적인 접근 방식이 필요합니다. 이는 효율적으로 실행되고 확장됨에 따라 효율성을 유지하는 애플리케이션을 개발하는 것을 의미합니다. 핵심 지표는 이 프로세스에서 매우 중요하며, 최적화 노력을 안내하는 실질적인 데이터를 제공합니다. 이러한 측정항목 중 일부를 살펴보겠습니다.
성능 모니터링을 위한 주요 지표
- 응답 시간: 이는 아마도 사용자 경험을 나타내는 가장 직접적인 지표일 것입니다. 사용자의 요청을 처리하고 응답을 다시 보내는 데 걸리는 시간을 측정합니다. Django 애플리케이션에서는 데이터베이스 쿼리, 뷰 처리, 미들웨어 작업과 같은 요소가 응답 시간에 영향을 미칠 수 있습니다.
- 처리량: 처리량은 특정 기간 내에 애플리케이션이 처리할 수 있는 요청 수를 나타냅니다.
- 오류율: 오류 빈도(4xx 및 5xx HTTP 응답)는 코드, 데이터베이스 쿼리 또는 서버 구성 문제를 나타낼 수 있습니다. 오류율을 모니터링하면 사용자 경험을 저하시킬 수 있는 문제를 신속하게 식별하고 수정할 수 있습니다.
- 데이터베이스 성능 지표: 여기에는 요청당 쿼리 수, 쿼리 실행 시간 및 데이터베이스 연결 효율성이 포함됩니다.
- 동시 사용자 처리: 여러 사용자가 동시에 Django 애플리케이션에 액세스하는 경우 모든 사용자에게 지연 없이 효율적으로 서비스를 제공할 수 있는 것이 중요합니다.
우리가 구축할 것
이 기사에서는 트래픽이 많은 이벤트에 대비한 Django 기반 전자 상거래 상점을 구축하고 AppSignal을 통합하여 부하 시 원활하게 확장되도록 모니터링, 최적화 및 보장합니다. 또한 성능 향상을 위해 AppSignal을 사용하여 기존 애플리케이션을 향상하는 방법(이 경우 Open edX 학습 관리 시스템)을 시연해 보겠습니다.
프로젝트 설정
전제조건
따라가려면 다음이 필요합니다.
- 파이썬 3.12.2
- AppSignal이 지원되는 운영체제
- AppSignal 계정
- Django 기본 지식
프로젝트 준비
이제 프로젝트용 디렉터리를 만들고 GitHub에서 복제해 보겠습니다. 모든 요구 사항을 설치하고 마이그레이션을 실행합니다.
mkdir django-performance && cd django-performance
python3.12 -m venv venv
source venv/bin/activate
git clone -b main https://github.com/amirtds/mystore
cd mystore
python3.12 -m pip install -r requirements.txt
python3.12 manage.py migrate
python3.12 manage.py runserver
이제 127.0.0.1:8000을 방문하세요. 다음과 같은 내용이 표시됩니다.
이 Django 애플리케이션은 사용자에게 제품 목록, 세부정보 및 결제 페이지를 제공하는 간단한 전자상거래 상점입니다. 앱을 성공적으로 복제하고 설치한 후 Django createsuperuser 관리 명령을 사용하여 슈퍼유저를 생성하세요.
이제 애플리케이션에서 몇 가지 제품을 만들어 보겠습니다. 먼저 다음을 실행하여 Django 애플리케이션을 실행합니다.
python3.12 manage.py shell
3개의 카테고리와 3개의 제품 만들기:
from store.models import Category, Product

# Create categories
electronics = Category(name='Electronics', description='Gadgets and electronic devices.')
books = Category(name='Books', description='Read the world.')
clothing = Category(name='Clothing', description='Latest fashion and trends.')

# Save categories to the database
electronics.save()
books.save()
clothing.save()

# Now let's create new Products with slugs and image URLs
Product.objects.create(
    category=electronics,
    name='Smartphone',
    description='Latest model with high-end specs.',
    price=799.99,
    stock=30,
    available=True,
    slug='smartphone',
    image='products/iphone_14_pro_max.png'
)

Product.objects.create(
    category=books,
    name='Python Programming',
    description='Learn Python programming with this comprehensive guide.',
    price=39.99,
    stock=50,
    available=True,
    slug='python-programming',
    image='products/python_programming_book.png'
)

Product.objects.create(
    category=clothing,
    name='Jeans',
    description='Comfortable and stylish jeans for everyday wear.',
    price=49.99,
    stock=20,
    available=True,
    slug='jeans',
    image='products/jeans.png'
)
이제 쉘을 닫고 서버를 실행하세요. 다음과 같은 내용이 표시됩니다.

AppSignal 설치
우리 프로젝트에 AppSignal과 opentelemetry-instrumentation-django를 설치하겠습니다.
이 패키지를 설치하기 전에 자격 증명을 사용하여 AppSignal에 로그인하세요(30일 무료 평가판에 등록할 수 있습니다). 기관을 선택한 후 탐색바 오른쪽 상단의 앱 추가를 클릭하세요. Python을 언어로 선택하면 push-api-key를 받게 됩니다.
가상 환경이 활성화되어 있는지 확인하고 다음 명령을 실행하세요.
python3.12 -m pip install appsignal==1.2.1
python3.12 -m appsignal install --push-api-key [YOU-KEY]
python3.12 -m pip install opentelemetry-instrumentation-django==0.45b0
CLI 프롬프트에 앱 이름을 제공합니다. 설치 후 프로젝트에 __appsignal__.py라는 새 파일이 표시됩니다.
Now let's create a new file called .env in the project root and add APPSIGNAL_PUSH_API_KEY=YOUR-KEY (remember to change the value to your actual key). Then, let's change the content of the __appsignal__.py file to the following:
# __appsignal__.py
import os
from appsignal import Appsignal

# Load environment variables from the .env file
from dotenv import load_dotenv
load_dotenv()

# Get APPSIGNAL_PUSH_API_KEY from environment
push_api_key = os.getenv('APPSIGNAL_PUSH_API_KEY')

appsignal = Appsignal(
    active=True,
    name="mystore",
    push_api_key=os.getenv("APPSIGNAL_PUSH_API_KEY"),
)
Next, update the manage.py file to read like this:
# manage.py
#!/usr/bin/env python
"""Django's command-line utility for administrative tasks."""
import os
import sys

# import appsignal
from __appsignal__ import appsignal # new line


def main():
    """Run administrative tasks."""
    os.environ.setdefault("DJANGO_SETTINGS_MODULE", "mystore.settings")

    # Start Appsignal
    appsignal.start() # new line

    try:
        from django.core.management import execute_from_command_line
    except ImportError as exc:
        raise ImportError(
            "Couldn't import Django. Are you sure it's installed and "
            "available on your PYTHONPATH environment variable? Did you "
            "forget to activate a virtual environment?"
        ) from exc
    execute_from_command_line(sys.argv)


if __name__ == "__main__":
    main()
We've imported AppSignal and started it using the configuration from __appsignal.py.
Please note that the changes we made to manage.py are for a development environment. In production, we should change wsgi.py or asgi.py. For more information, visit AppSignal's Django documentation.
Project Scenario: Optimizing for a New Year Sale and Monitoring Concurrent Users
As we approach the New Year sales on our Django-based e-commerce platform, we recall last year's challenges: increased traffic led to slow load times and even some downtime. This year, we aim to avoid these issues by thoroughly testing and optimizing our site beforehand. We'll use Locust to simulate user traffic and AppSignal to monitor our application's performance.
Creating a Locust Test for Simulated Traffic
First, we'll create a locustfile.py file that simulates simultaneous users navigating through critical parts of our site: the homepage, a product detail page, and the checkout page. This simulation helps us understand how our site performs under pressure.
Create the locustfile.py in the project root:
# locustfile.py
from locust import HttpUser, between, task

class WebsiteUser(HttpUser):
    wait_time = between(1, 3)  # Users wait 1-3 seconds between tasks

    @task
    def index_page(self):
        self.client.get("/store/")

    @task(3)
    def view_product_detail(self):
        self.client.get("/store/product/smartphone/")

    @task(2)
    def view_checkout_page(self):
        self.client.get("/store/checkout/smartphone/")
In locustfile.py, users primarily visit the product detail page, followed by the checkout page, and occasionally return to the homepage. This pattern aims to mimic realistic user behavior during a sale.
Before running Locust, ensure you have a product with the smartphone slug in the Django app. If you don't, go to /admin/store/product/ and create one.
Defining Acceptable Response Times
Before we start, let's define what we consider an acceptable response time. For a smooth user experience, we aim for:
- Homepage and product detail pages: under 1 second.
- Checkout page: under 1.5 seconds (due to typically higher complexity).
These targets ensure users experience minimal delay, keeping their engagement high.
Conducting the Test and Monitoring Results
With our Locust test ready, we run it to simulate the 500 users and observe the results in real time. Here's how:
- Start the Locust test by running locust -f locustfile.py in your terminal, then open http://localhost:8089 to set up and start the simulation. Set the Number of Users to 500 and set the host to http://127.0.0.1:8000
- Monitor performance in both Locust's web interface and AppSignal. Locust shows us request rates and response times, while AppSignal provides deeper insights into our Django app's behavior under load.
After running Locust, you can find information about the load test in its dashboard:

Now, go to your application page in AppSignal. Under the Performance section, click on Actions and you should see something like this:
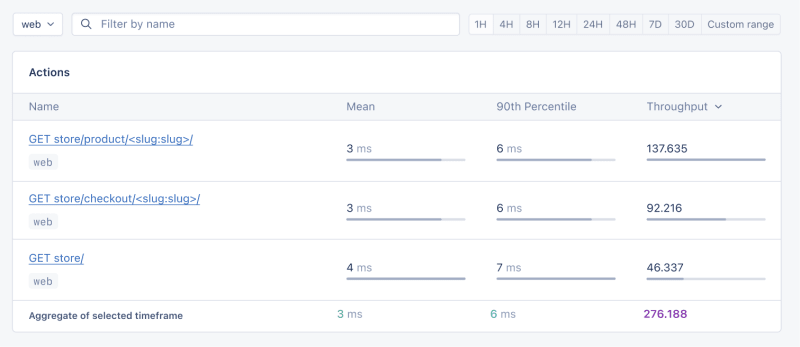
- Mean: This is the average response time for all the requests made to a particular endpoint. It provides a general idea of how long it takes for the server to respond. In our context, any mean response time greater than 1 second could be considered a red flag, indicating that our application's performance might not meet user expectations for speed.
- 90th Percentile: This is the response time at the 90th percentile. For example, for GET store/, we have 7 ms, which means 90% of requests are completed in 7 ms or less.
- Throughput: The number of requests handled per second.
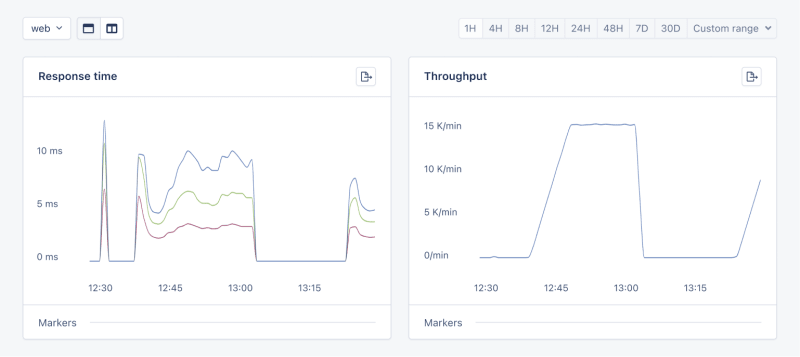
Now let's click on the Graphs under Performance:
We need to prepare our site for the New Year sales, as response times might exceed our targets. Here's a simplified plan:
- Database Queries: Slow queries often cause performance issues.
- Static Assets: Ensure static assets are properly cached. Use a CDN for better delivery speeds.
- Application Resources: Sometimes, the solution is as straightforward as adding more RAM and CPUs.
Database Operations
Understanding Database Performance Impact
When it comes to web applications, one of the most common sources of slow performance is database queries. Every time a user performs an action that requires data retrieval or manipulation, a query is made to the database.
If these queries are not well-optimized, they can take a considerable amount of time to execute, leading to a sluggish user experience. That's why it's crucial to monitor and optimize our queries, ensuring they're efficient and don't become the bottleneck in our application's performance.
Instrumentation and Spans
Before diving into the implementation, let's clarify two key concepts in performance monitoring:
- Instrumentation
- Spans
Instrumentation is the process of augmenting code to measure its performance and behavior during execution. Think of it like fitting your car with a dashboard that tells you not just the speed, but also the engine's performance, fuel efficiency, and other diagnostics while you drive.
Spans, on the other hand, are the specific segments of time measured by instrumentation. In our car analogy, a span would be the time taken for a specific part of your journey, like from your home to the highway. In the context of web applications, a span could represent the time taken to execute a database query, process a request, or complete any other discrete operation.
Instrumentation helps us create a series of spans that together form a detailed timeline of how a request is handled. This timeline is invaluable for pinpointing where delays occur and understanding the overall flow of a request through our system.
Implementing Instrumentation in Our Code
With our PurchaseProductView, we're particularly interested in the database interactions that create customer records and process purchases. By adding instrumentation to this view, we'll be able to measure these interactions and get actionable data on their performance.
Here's how we integrate AppSignal's custom instrumentation into our Django view:
# store/views.py
# Import OpenTelemetry's trace module for creating custom spans
from opentelemetry import trace
# Import AppSignal's set_root_name for customizing the trace name
from appsignal import set_root_name

# Inside the PurchaseProductView
def post(self, request, *args, **kwargs):
    # Initialize the tracer for this view
    tracer = trace.get_tracer(__name__)

    # Start a new span for the view using 'with' statement
    with tracer.start_as_current_span("PurchaseProductView"):
        # Customize the name of the trace to be more descriptive
        set_root_name("POST /store/purchase/<slug>")

        # ... existing code to handle the purchase ...

        # Start another span to monitor the database query performance
        with tracer.start_as_current_span("Database Query - Retrieve or Create Customer"):
            # ... code to retrieve or create a customer ...

            # Yet another span to monitor the purchase record creation
            with tracer.start_as_current_span("Database Query - Create Purchase Record"):
                # ... code to create a purchase record ...
See the full code of the view after the modification.
In this updated view, custom instrumentation is added to measure the performance of database queries when retrieving or creating a customer and creating a purchase record.
Now, after purchasing a product in the Slow events section of the Performance dashboard, you should see the purchase event, its performance, and how long it takes to run the query.

purchase is the event we added to our view.
Using AppSignal with an Existing Django App
In this section, we are going to see how we can integrate AppSignal with Open edX, an open-source learning management system based on Python and Django.
Monitoring the performance of learning platforms like Open edX is highly important, since a slow experience directly impacts students' engagement with learning materials and can have a negative impact (for example, a high number of users might decide not to continue with a course).
Integrate AppSignal
Here, we can follow similar steps as the Project Setup section. However, for Open edX, we will follow Production Setup and initiate AppSignal in wsgi.py. Check out this commit to install and integrate AppSignal with Open edX.
Monitor Open edX Performance
Now we'll interact with our platform and see the performance result in the dashboard.
Let's register a user, log in, enroll them in multiple courses, and interact with the course content.
Actions
Going to Actions, let's order the actions based on their mean time and find slow events:
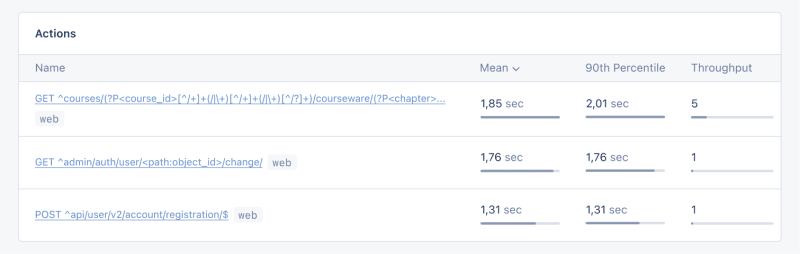
As we can see, for 3 events (out of the 34 events we tested) the response time is higher than 1 second.
Host Metrics
Host Metrics in AppSignal show resource usage:

저희 시스템은 부하가 높지는 않지만(평균 부하가 0.03입니다), 메모리 사용량이 높습니다.
리소스 사용량이 특정 조건에 도달하면 알림을 받는 트리거를 추가할 수도 있습니다. 예를 들어, 메모리 사용량이 80%를 초과하면 알림을 받고 중단을 방지하기 위해 트리거를 설정할 수 있습니다.

조건에 도달하면 다음과 같은 알림을 받게 됩니다.

셀러리 작업 모니터링
Open edX에서는 인증서 생성, 채점, 대량 이메일 기능과 같은 비동기식 및 장기 실행 작업에 Celery를 사용합니다.
작업 및 사용자 수에 따라 이러한 작업 중 일부는 장시간 실행되어 플랫폼 성능 문제를 일으킬 수 있습니다.
예를 들어 수천 명의 사용자가 강좌에 등록되어 있고 이들의 점수를 다시 매겨야 하는 경우 이 작업에는 시간이 걸릴 수 있습니다. 작업이 아직 실행 중이기 때문에 성적이 대시보드에 반영되지 않는다는 불만이 사용자로부터 접수될 수 있습니다. Celery 작업, 해당 런타임 및 리소스 사용량에 대한 정보가 있으면 애플리케이션에 대한 중요한 통찰력과 가능한 개선점을 얻을 수 있습니다.
AppSignal을 사용하여 Open edX에서 Celery 작업을 추적하고 대시보드에서 결과를 확인해 보겠습니다. 먼저, 필요한 요구사항이 설치되어 있는지 확인하세요. 다음으로, 이 커밋과 같이 Celery 성능을 추적하는 작업을 설정해 보겠습니다.
이제 Open edX 대시보드에서 몇 가지 작업을 실행하여 시도를 재설정하고 학습자의 제출물 점수를 다시 매겨 보겠습니다.
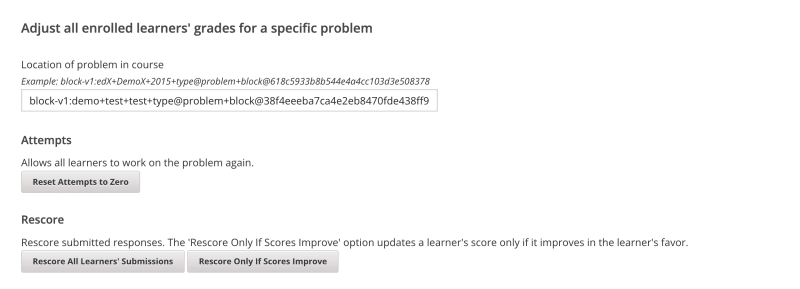
AppSignal의 성능 대시보드로 이동합니다 -> 느린 이벤트 다음과 같은 내용이 표시됩니다.
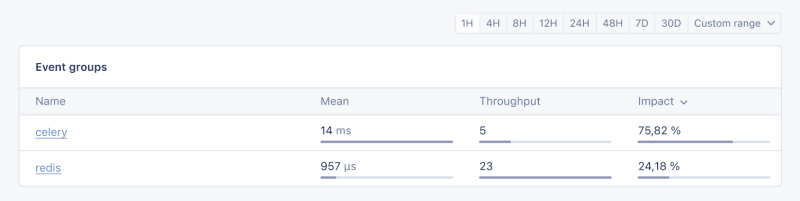
Celery를 클릭하면 Open edX에서 실행된 모든 작업이 표시됩니다.

이는 작업이 예상보다 오래 실행되는지 확인하고 가능한 성능 병목 현상을 해결할 수 있는 데 도움이 되는 유용한 정보입니다.
그리고 그게 다입니다!
마무리
이 기사에서는 AppSignal이 어떻게 Django 앱의 성능에 대한 통찰력을 제공할 수 있는지 살펴보았습니다.
동시 사용자, 데이터베이스 쿼리, 응답 시간 등의 지표를 포함한 간단한 전자상거래 Django 애플리케이션을 모니터링했습니다.
사례 연구로서 우리는 AppSignal을 Open edX와 통합하여 성능 모니터링이 특히 플랫폼을 사용하는 학생들의 사용자 경험을 향상시키는 데 어떻게 중요한 역할을 하는지 보여주었습니다.
즐거운 코딩하세요!
P.S. Python 게시물이 보도되자마자 읽고 싶다면 Python Wizardry 뉴스레터를 구독하고 게시물 하나도 놓치지 마세요!
위 내용은 AppSignal을 사용하여 Python Django 앱 성능 모니터링의 상세 내용입니다. 자세한 내용은 PHP 중국어 웹사이트의 기타 관련 기사를 참조하세요!