
timeit.repeat - 반복을 통해 패턴을 이해합니다.

- 王林원래의
- 2024-08-09 07:25:021191검색
1. 문제
소프트웨어 엔지니어링 경력을 쌓다 보면 성능이 좋지 않아 허용 가능한 것보다 훨씬 오랜 시간이 걸리는 코드 조각을 접하게 될 수도 있습니다. 설상가상으로 여러 실행에서 성능이 일관되지 않고 상당히 가변적입니다.
이 시점에서는 소프트웨어 성능과 관련하여 많은 비결정론이 작용하고 있다는 사실을 받아들여야 합니다. 데이터는 창 내에 분포될 수 있으며 때로는 정규 분포를 따릅니다. 때로는 뚜렷한 패턴이 없어 불규칙할 수도 있습니다.
2. 접근방식
이때 벤치마킹이 시작됩니다. 코드를 5번 실행하는 것은 좋지만 결국에는 데이터 포인트가 5개뿐이고 각 데이터 포인트에 너무 많은 값이 할당됩니다. 패턴을 보려면 동일한 코드 블록을 훨씬 더 많이 반복해야 합니다.
3. 질문
데이터 포인트는 몇 개나 있어야 하나요? 이에 대해 많은 글이 쓰여졌고, 제가 다룬 논문 중 하나입니다
엄격한 성능 평가를 위해서는 벤치마크 구축이 필요하며,
무작위로 처리하기 위해 여러 번 실행하고 측정했습니다
실행 시간의 변화. 연구자들은 대책을 마련해야 한다
결과를 보고할 때 변동이 있을 수 있습니다.
Kalibera, T., & Jones, R.(2013). 합리적인 시간 내에 엄격한 벤치마킹. 2013 메모리 관리 국제 심포지엄 논문집. https://doi.org/10.1145/2491894.2464160
성능을 측정할 때 성능을 더 폭넓게 파악하기 위해 CPU, 메모리 또는 디스크 사용량을 측정할 수 있습니다. 일반적으로 경과 시간과 같은 간단한 것부터 시작하는 것이 가장 좋습니다. 시각화하기가 더 쉽기 때문입니다. 17%의 CPU 사용량은 우리에게 많은 것을 알려주지 않습니다. 그것은 무엇이어야합니까? 20% 또는 5? CPU 사용량은 인간이 성능을 인식하는 자연스러운 방식 중 하나가 아닙니다.
4. 실험
파이썬의 timeit.repeat 메서드를 사용하여 간단한 코드 실행 블록을 반복해 보겠습니다. 코드 블록은 1에서 2000까지의 숫자만 곱합니다.
from functools import reduce
reduce((lambda x, y: x * y), range(1, 2000))
메서드 시그니처입니다
(function) def repeat(
    stmt: _Stmt = "pass",
    setup: _Stmt = "pass",
    timer: _Timer = ...,
    repeat: int = 5,
    number: int = 1000000,
    globals: dict[str, Any] | None = None
) -> list[float]
반복과 숫자란 무엇인가요?
숫자부터 시작하겠습니다. 코드 블록이 너무 작으면 너무 빨리 종료되어 아무것도 측정할 수 없게 됩니다. 이 인수는 stmt가 실행되어야 하는 횟수를 언급합니다. 이것을 새로운 코드 블록으로 간주할 수 있습니다. 반환된 부동소수점은 stmt X 번호 실행 시간에 대한 것입니다.
우리의 경우 2000까지 곱하는 것은 비용이 많이 들기 때문에 1000으로 유지하겠습니다.
다음으로 반복하세요. 반복 횟수 또는 위 블록을 실행해야 하는 횟수를 지정합니다. 반복이 5이면 list[float]는 5개의 요소를 반환합니다.
간단한 실행 블록을 만드는 것부터 시작해 보겠습니다
def run_experiment(number_of_repeats, number_of_runs=1000):
    execution_time = timeit.repeat(
        "from functools import reduce; reduce((lambda x, y: x * y), range(1, 2000))",
        repeat=number_of_repeats,
        number=number_of_runs
    )
    return execution_time
다른 반복 값으로 실행하고 싶습니다
repeat_values = [5, 20, 100, 500, 3000, 10000]
코드는 매우 간단하고 간단합니다
5. 결과 탐색
이제 실험의 가장 중요한 부분인 데이터 해석에 도달했습니다. 사람마다 다르게 해석할 수 있으며 정답은 없다는 점을 참고하시기 바랍니다.
정답에 대한 정의는 달성하려는 목표에 따라 크게 달라집니다. 사용자 중 95%의 성능 저하가 걱정됩니까? 아니면, 목소리가 꽤 큰 5% 유저들의 성능저하가 걱정되시나요?
5.1. 여러 반복 값에 대한 실행 시간 분석 통계
보시다시피 최소 및 최대 시간이 이상합니다. 이는 하나의 데이터 포인트가 평균 값을 변경하는 데 어떻게 충분할 수 있는지 보여줍니다. 최악의 부분은 높은 최소값과 높은 최대값이 서로 다른 반복 값에 대한 것입니다. 상관관계가 없으며 단지 이상값의 힘을 보여줄 뿐입니다.
다음으로 중앙값으로 이동하여 반복 횟수를 늘리면 20을 제외하고 중앙값이 낮아지는 것을 확인합니다. 이를 설명할 수 있는 것은 무엇입니까? 반복 횟수가 적다는 것은 가능한 값을 최대한 활용하지 못한다는 것을 의미합니다.
최하위 2.5%와 최고 2.5%가 잘린 절사 평균으로 이동합니다. 이는 이상치 사용자에 관심이 없고 중간 95% 사용자의 성능에 집중하고 싶을 때 유용합니다.
중간 95% 사용자의 성능을 향상시키려고 하면 이상치 5% 사용자의 성능이 저하될 가능성이 있으므로 주의하세요.

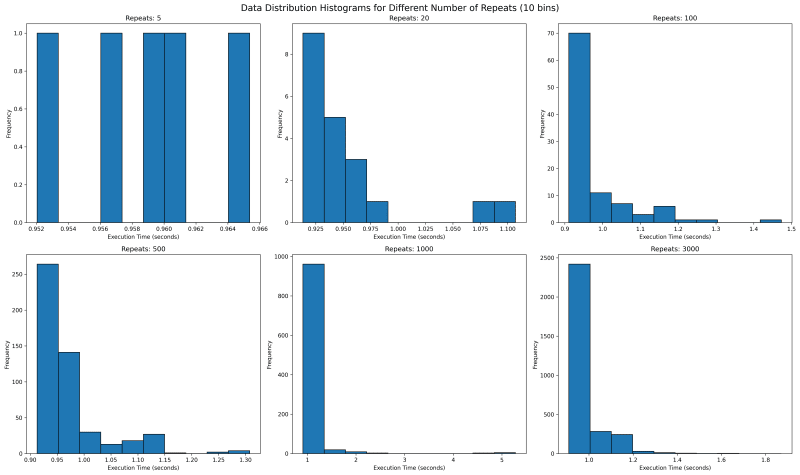
5.2. Execution Time Distribution for multiple values of repeat
Next we want to see where all the data lies. We would use histogram with bin of 10 to see where the data falls. With repetitions of 5 we see that they are mostly equally spaced. This is not one usually expects as sampled data should follow a normal looking distribution.
In our case the value is bounded on the lower side and unbounded on the upper side, since it will take more than 0 seconds to run any code, but there is no upper time limit. This means our distribution should look like a normal distribution with a long right tail.
Going forward with higher values of repeat, we see a tail emerging on the right. I would expect with higher number of repeat, there would be a single histogram bar, which is tall enough that outliers are overshadowed.
5.3. Execution Time Distribution for values 1000 and 3000
How about we look at larger values of repeat to get a sense? We see something unusual. With 1000 repeats, there are a lot of outliers past 1.8 and it looks a lot more tighter. The one on the right with 3000 repeat only goes upto 1.8 and has most of its data clustered around two peaks.
What can it mean? It can mean a lot of things including the fact that sometimes maybe the data gets cached and at times it does not. It can point to many other side effects of your code, which you might have never thought of. With the kind of distribution of both 1000 and 3000 repeats, I feel the TM95 for 3000 repeat is the most accurate value.

6. Appendix
6.1. Code
import timeit
import matplotlib.pyplot as plt
import json
import os
import statistics
import numpy as np

def run_experiment(number_of_repeats, number_of_runs=1000):
    execution_time = timeit.repeat(
        "from functools import reduce; reduce((lambda x, y: x * y), range(1, 2000))",
        repeat=number_of_repeats,
        number=number_of_runs
    )
    return execution_time

def save_result(result, repeats):
    filename = f'execution_time_results_{repeats}.json'
    with open(filename, 'w') as f:
        json.dump(result, f)

def load_result(repeats):
    filename = f'execution_time_results_{repeats}.json'
    if os.path.exists(filename):
        with open(filename, 'r') as f:
            return json.load(f)
    return None

def truncated_mean(data, percentile=95):
    data = np.array(data)
    lower_bound = np.percentile(data, (100 - percentile) / 2)
    upper_bound = np.percentile(data, 100 - (100 - percentile) / 2)
    return np.mean(data[(data >= lower_bound) & (data <= upper_bound)])

# List of number_of_repeats to test
repeat_values = [5, 20, 100, 500, 1000, 3000]

# Run experiments and collect results
results = []
for repeats in repeat_values:
    result = load_result(repeats)
    if result is None:
        print(f"Running experiment for {repeats} repeats...")
        try:
            result = run_experiment(repeats)
            save_result(result, repeats)
            print(f"Experiment for {repeats} repeats completed and saved.")
        except KeyboardInterrupt:
            print(f"\nExperiment for {repeats} repeats interrupted.")
            continue
    else:
        print(f"Loaded existing results for {repeats} repeats.")

    # Print time taken per repetition
    avg_time = statistics.mean(result)
    print(f"Average time per repetition for {repeats} repeats: {avg_time:.6f} seconds")

    results.append(result)

trunc_means = [truncated_mean(r) for r in results]
medians = [np.median(r) for r in results]
mins = [np.min(r) for r in results]
maxs = [np.max(r) for r in results]

# Create subplots
fig, axs = plt.subplots(2, 2, figsize=(15, 12))
fig.suptitle('Execution Time Analysis for Different Number of Repeats', fontsize=16)

metrics = [
    ('Truncated Mean (95%)', trunc_means),
    ('Median', medians),
    ('Min', mins),
    ('Max', maxs)
]

for (title, data), ax in zip(metrics, axs.flatten()):
    ax.plot(repeat_values, data, marker='o')
    ax.set_title(title)
    ax.set_xlabel('Number of Repeats')
    ax.set_ylabel('Execution Time (seconds)')
    ax.set_xscale('log')
    ax.grid(True, which="both", ls="-", alpha=0.2)

    # Set x-ticks and labels for each data point
    ax.set_xticks(repeat_values)
    ax.set_xticklabels(repeat_values)

    # Rotate x-axis labels for better readability
    ax.tick_params(axis='x', rotation=45)

plt.tight_layout()

# Save the plot to a file
plt.savefig('execution_time_analysis.png', dpi=300, bbox_inches='tight')
print("Plot saved as 'execution_time_analysis.png'")

# Create histograms for data distribution with 10 bins
fig, axs = plt.subplots(2, 3, figsize=(20, 12))
fig.suptitle('Data Distribution Histograms for Different Number of Repeats (10 bins)', fontsize=16)

for repeat, result, ax in zip(repeat_values, results, axs.flatten()):
    ax.hist(result, bins=10, edgecolor='black')
    ax.set_title(f'Repeats: {repeat}')
    ax.set_xlabel('Execution Time (seconds)')
    ax.set_ylabel('Frequency')

plt.tight_layout()

# Save the histograms to a file
plt.savefig('data_distribution_histograms_10bins.png', dpi=300, bbox_inches='tight')
print("Histograms saved as 'data_distribution_histograms_10bins.png'")

# Create histograms for 1000 and 3000 repeats with 30 bins
fig, axs = plt.subplots(1, 2, figsize=(15, 6))
fig.suptitle('Data Distribution Histograms for 1000 and 3000 Repeats (30 bins)', fontsize=16)

for repeat, result, ax in zip([1000, 3000], results[-2:], axs):
    ax.hist(result, bins=100, edgecolor='black')
    ax.set_title(f'Repeats: {repeat}')
    ax.set_xlabel('Execution Time (seconds)')
    ax.set_ylabel('Frequency')

plt.tight_layout()

# Save the detailed histograms to a file
plt.savefig('data_distribution_histograms_detailed.png', dpi=300, bbox_inches='tight')
print("Detailed histograms saved as 'data_distribution_histograms_detailed.png'")

plt.show()
위 내용은 timeit.repeat - 반복을 통해 패턴을 이해합니다.의 상세 내용입니다. 자세한 내용은 PHP 중국어 웹사이트의 기타 관련 기사를 참조하세요!