
대화형 주사위 굴림 데이터 시각화를 위해 Plotly 사용

- PHPz원래의
- 2024-07-18 22:55:01743검색
이 튜토리얼에서는 Plotly를 사용하여 대화형 시각화를 만드는 방법을 알아봅니다. 우리 프로젝트는 주사위 굴리기의 결과를 분석하는 데 중점을 둡니다. 단일 6면체 주사위를 굴릴 때 1부터 6까지의 숫자가 나올 확률은 동일합니다. 그러나 여러 개의 주사위를 굴릴 때 일부 숫자는 다른 숫자보다 가능성이 높아집니다. 우리의 목표는 주사위 굴림을 시뮬레이션하고 데이터 세트를 생성하여 이러한 확률을 결정하는 것입니다. 그런 다음 여러 롤의 결과를 시각적으로 표현하여 어떤 결과가 통계적으로 더 가능성이 높은지 보여줍니다.
플로틀리란 무엇인가요?
Plotly는 사용자가 대화형 웹 기반 시각화를 만들 수 있는 오픈 소스 그래프 라이브러리입니다. 선 도표, 분산형 도표, 막대 차트 등을 포함한 다양한 차트 유형을 지원합니다. Plotly는 확대/축소, 패닝, 호버 정보와 같은 대화형 기능을 제공하므로 웹 애플리케이션에 포함할 수 있는 시각화를 만드는 데 특히 유용합니다.
Plotly 설치
pip를 사용하여 Plotly를 설치하겠습니다. Plotly Express가 의존하기 때문에 효율적인 데이터 작업을 위한 라이브러리인 pandas도 설치해야 합니다.
$ python -m pip install --user plotly
$ python -m pip install --user pandas
Plotly 웹사이트의 차트 유형 갤러리를 방문하여 Plotly로 만들 수 있는 다양한 시각화를 확인하세요.
다이 클래스 생성
먼저 주사위 굴림을 시뮬레이션하기 위해 다음 Die 클래스를 만듭니다. 파일 이름을 Die.py로 지정하겠습니다.
from random import randint

class Die:
    """A class representing a single die."""

    def __init__(self, num_sides = 6):
        """Assume a six-sided die"""
        self.num_sides = num_sides


    def roll(self):
        """Return a random value between 1 and number of sides."""
        return randint(1, self.num_sides)
__ init __ 메소드는 하나의 선택적 인수를 사용합니다. Die 인스턴스가 생성될 때 인수가 제공되지 않으면 변의 수는 6이 됩니다. 인수가 주어지면 주사위의 면 수를 설정합니다.
roll() 메서드는 randint() 함수를 사용하여 1과 변 수 사이의 난수를 반환합니다. 이 함수는 시작 값(1), 종료 값(num_sides) 또는 그 사이의 정수를 반환할 수 있습니다. 주사위는 면 수에 따라 이름이 지정됩니다. 6면체 주사위는 D6라고 하고, 10면체 주사위는 D10이라고 합니다.
주사위 굴리기
plotly.express를 반복적으로 입력하는 것을 피하기 위해 먼저 별칭 px를 사용하여 Plotly Express 모듈을 가져옵니다. 두 개의 D8 주사위 굴림을 시뮬레이션하기 위해 주사위 인스턴스를 만듭니다. 이 파일의 이름은 dice_visual.py입니다.
import plotly.express as px

from die import Die

# Create two D8.
die_1 = Die(8)
die_2 = Die(8)

# Make some rolls, and store results in a list.
results = []
for roll_num in range(500_000):
    result = die_1.roll() + die_2.roll()
    results.append(result)
결과 분석
가능한 가장 작은 결과는 각 주사위에서 가장 작은 숫자의 합(2)입니다. 가능한 가장 큰 결과는 max_results에 할당된 각 주사위의 가장 큰 숫자(16)의 합입니다. max_result 변수는 poss_results 생성을 위한 코드의 가독성을 향상시킵니다. 범위(2,16)를 쓸 수도 있지만 이는 두 개의 D8 주사위에만 작동합니다. 실제 상황을 시뮬레이션할 때는 다양한 시나리오를 쉽게 처리할 수 있는 코드를 개발하는 것이 가장 좋습니다.
# Analyze the result.
frequencies = []
max_results = die_1.num_sides + die_2.num_sides
poss_results = range(2, max_results + 1)
for value in poss_results:
    frequency = results.count(value)
    frequencies.append(frequency)
결과 시각화.
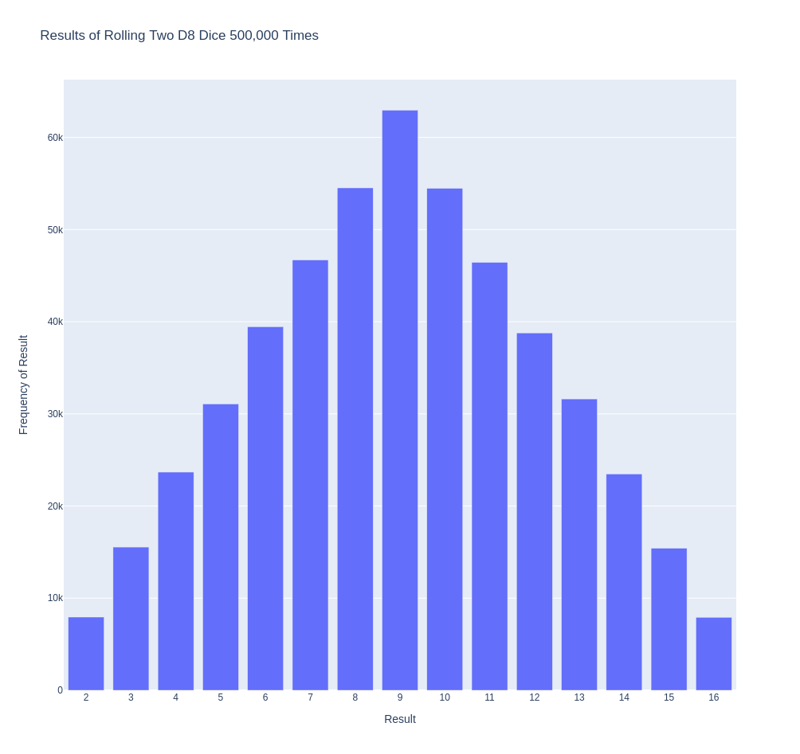
제목을 정의하고 '제목'으로 지정했습니다. 축 레이블을 지정하기 위해 사전을 만들었습니다. 사전의 키는 사용자 정의하려는 레이블을 나타내고, 값은 사용하려는 사용자 정의 레이블을 나타냅니다. x축의 이름을 '결과'로 지정하고 y축의 이름을 '결과 빈도'로 지정합니다. 막대 그래프를 작성하려면 px.bar() 함수를 사용하고 선택적 변수 'title' 및 'labels'를 전달합니다.
# Visualize the results.
title = "Results of Rolling Two D8 Dice 500,000 Times"
labels = {'x': 'Result', 'y': 'Frequency of Result'}
fig = px.bar(x = poss_results, y = frequencies, title = title,
 labels = labels)
fig.show()
아래 그림과 같이 각 축에 적절한 제목과 레이블이 포함된 플롯이 생성됩니다.

추가 사용자 정의
방금 만든 플롯에서 해결해야 할 문제가 하나 있습니다. 11개의 막대가 있으므로 기본 x축 레이아웃 설정에서는 일부 막대에 레이블이 지정되지 않은 상태로 유지됩니다. 기본 설정은 대부분의 시각화에 적합하지만 모든 막대에 레이블이 지정되어 있으면 이 차트가 더 잘 나타납니다.
Plotly는 Figure가 생성된 후 Figure를 다양하게 변경할 수 있는 update_layout() 메서드를 제공합니다. 각 막대에 고유한 레이블을 지정하도록 Plotly에 지시하는 방법은 다음과 같습니다.
# Further customize chart.
fig.update_layout(xaxis_dtick = 1)
fig.show()
#fig.write_html('dice_visual_d6d10.xhtml')
update_layout() 메서드는 전체 차트를 나타내는 fig 객체에 적용됩니다. xaxis_dtick 옵션을 사용하여 x축의 눈금 표시 사이의 거리를 설정합니다. 각 막대에 레이블이 지정되도록 간격을 1로 설정했습니다. dice_visual.py를 다시 실행하면 각 막대에 레이블이 표시됩니다.
이 코드는 쉽게 사용자 정의하여 다양한 크기의 주사위 굴리기를 시뮬레이션할 수 있습니다. D6 및 D10을 생성하려면 두 개의 다이 인스턴스를 생성할 때 인수 6과 10을 전달합니다. 첫 번째 루프를 원하는 롤 수로 변경하고 이에 따라 그래프 제목을 변경합니다.
We can get our program to save the chart as an HTML file automatically by replacing the call to fig.show() with a call to fig.write_html().
The write_html() method requires one argument: the name of the file to write to. If you only provide a filename, the file will be saved in the same directory as the .py file. You can also call write_html() with a Path object to save the output file anywhere on your system.
Here is the complete code:
import plotly.express as px

from die import Die

# Create two D8.
die_1 = Die(8)
die_2 = Die(8)

# Make some rolls, and store results in a list.
results = []
for roll_num in range(500_000):
    result = die_1.roll() + die_2.roll()
    results.append(result)

# Analyze the result.
frequencies = []
max_results = die_1.num_sides + die_2.num_sides
poss_results = range(2, max_results + 1)
for value in poss_results:
    frequency = results.count(value)
    frequencies.append(frequency)

# Visualize the results.
title = "Results of Rolling Two D8 Dice 500,000 Times"
labels = {'x': 'Result', 'y': 'Frequency of Result'}
fig = px.bar(x = poss_results, y = frequencies, title = title, labels = labels)

# Further customize chart.
fig.update_layout(xaxis_dtick = 1)
fig.write_html('dice_visual.xhtml')
Refactoring
For clarity, the listings in this section use the long form of for loops. We can refactor the code by using list comprehensions for one or both of the loops. Here is the code using list comprehension:
import plotly.express as px

from die import Die

# Create two D8.
die_1 = Die(8)
die_2 = Die(8)

# Make some rolls, and store results in a list.
results = [die_1.roll() + die_2.roll() for roll_num in range(500_000) ]

# Analyze the result.
max_results = die_1.num_sides + die_2.num_sides
poss_results = range(2, max_results + 1)
frequencies = [results.count(value) for value in poss_results]

# Visualize the results.
title = "Results of Rolling Two D8 Dice 500,000 Times"
labels = {'x': 'Result', 'y': 'Frequency of Result'}
fig = px.bar(x = poss_results, y = frequencies, title = title, labels = labels)

# Further customize chart.
fig.update_layout(xaxis_dtick = 1)

fig.write_html('dice_visual_list_comprehension.xhtml')
Conclusion
In conclusion, analyzing and presenting statistical data becomes powerful and engaging with Plotly for interactive dice roll data visualization. By simulating dice rolls and visualizing the outcomes, we can better understand the probabilities of different results. Plotly's interactive features, such as hover information, panning, and zooming, enhance the user experience and make data more accessible. Additionally, the ability to customize and save visualizations as HTML files makes it easy to share and integrate them into web applications. This article demonstrates how to use Plotly's features to create informative and attractive charts. Plotly is an excellent tool for data analysis and presentation.
위 내용은 대화형 주사위 굴림 데이터 시각화를 위해 Plotly 사용의 상세 내용입니다. 자세한 내용은 PHP 중국어 웹사이트의 기타 관련 기사를 참조하세요!