ホームページ >バックエンド開発 >Python チュートリアル >視覚化 | Python が中秋の月餅を分析、これらの味が yyds です!
視覚化 | Python が中秋の月餅を分析、これらの味が yyds です!
- Python当打之年転載
- 2023-08-10 15:25:061416ブラウズ
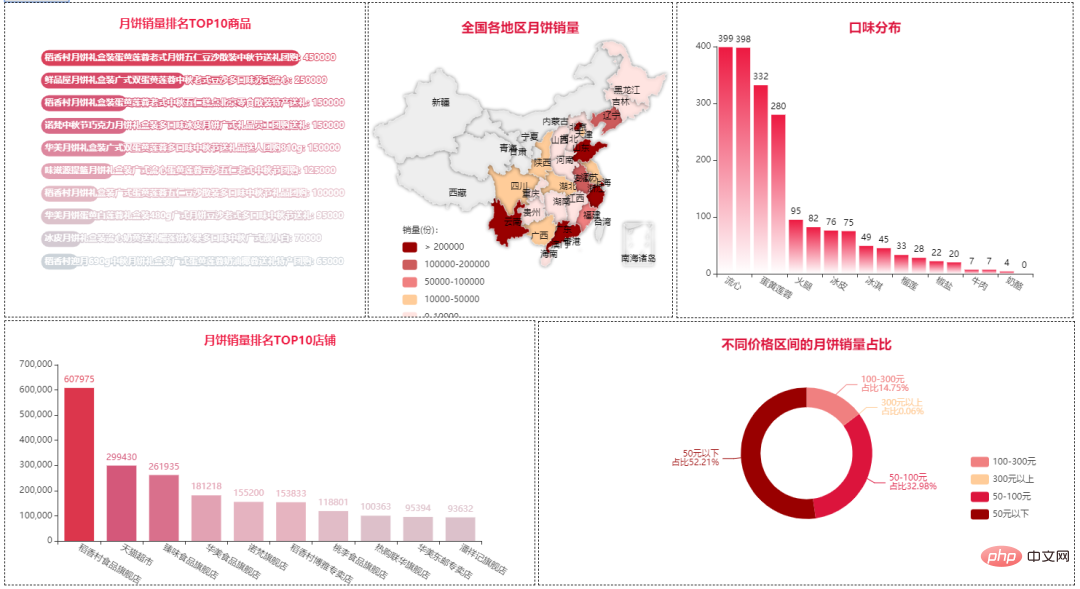
Pyecharts — データ視覚化
jieba — 分詞 collections — データ統計
視覚化部分:
Bar# — 棒グラフ -
##円グラフ — 円グラフ #地図 #— 地図 - スタイルクラウド
— ワードクラウド
import re
import jieba
import stylecloud
import numpy as np
import pandas as pd
from collections import Counter
from pyecharts.charts import Bar
from pyecharts.charts import Map
from pyecharts.charts import Pie
from pyecharts.charts import Grid
from pyecharts.charts import Page
from pyecharts.components import Image
from pyecharts.charts import WordCloud
from pyecharts import options as opts
from pyecharts.globals import SymbolType
from pyecharts.commons.utils import JsCode
df = pd.read_excel("月饼.xlsx")
df.head(10)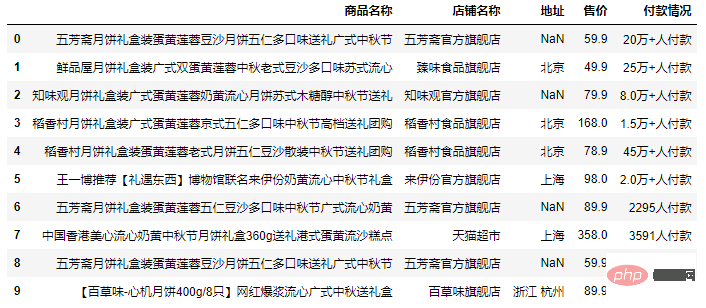
print(df.shape)
df.drop_duplicates(inplace=True)
print(df.shape)
(4520, 5)
(1885, 5)
处理购买人数为空的记录:df['付款情况'] = df['付款情况'].replace(np.nan,'0人付款')
2.4 处理付款情况字段
df[df['付款情况'].str.contains("万")]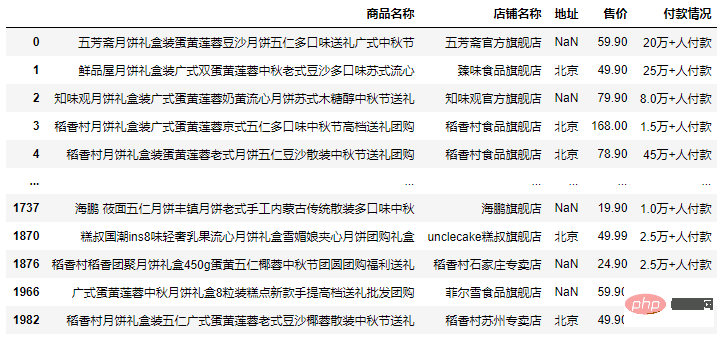
付款人数超过10000后会直接用"万"替代,这里我们需要将其恢复:
# 提取数值
df['num'] = [re.findall(r'(\d+\.{0,1}\d*)', i)[0] for i in df['付款情况']]
df['num'] = df['num'].astype('float')

# 提取单位(万)
df['unit'] = [''.join(re.findall(r'(万)', i)) for i in df['付款情况']]
df['unit'] = df['unit'].apply(lambda x:10000 if x=='万' else 1)

# 计算销量
df['销量'] = df['num'] * df['unit']
df = df[df['地址'].notna()]
df['省份'] = df['地址'].str.split(' ').apply(lambda x:x[0])

# 删除多余的列
df.drop(['付款情况', 'num', 'unit'], axis=1, inplace=True)

# 重置索引
df = df.reset_index(drop=True)
结果:
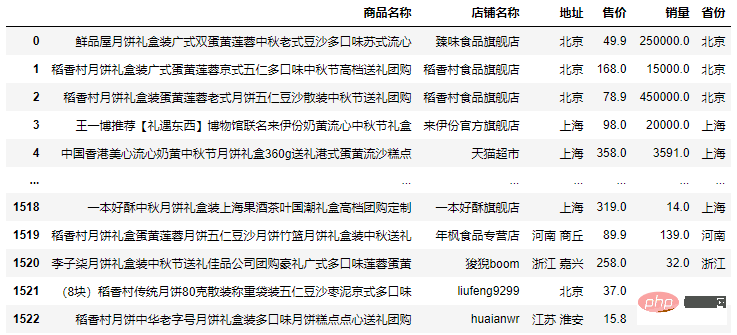
代码:
shop_top10 = df.groupby('商品名称')['销量'].sum().sort_values(ascending=False).head(10)
bar0 = (
    Bar()
        .add_xaxis(shop_top10.index.tolist()[::-1])
        .add_yaxis('sales_num', shop_top10.values.tolist()[::-1])
        .reversal_axis()
        .set_global_opts(title_opts=opts.TitleOpts(title='月饼商品销量Top10'),
                         xaxis_opts=opts.AxisOpts(axislabel_opts=opts.LabelOpts(rotate=-30)))
        .set_series_opts(label_opts=opts.LabelOpts(position='right'))
)
效果:
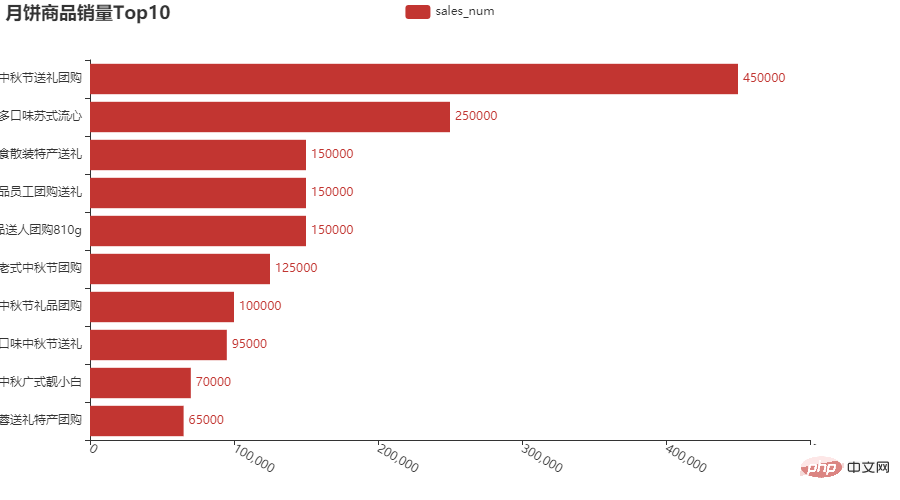
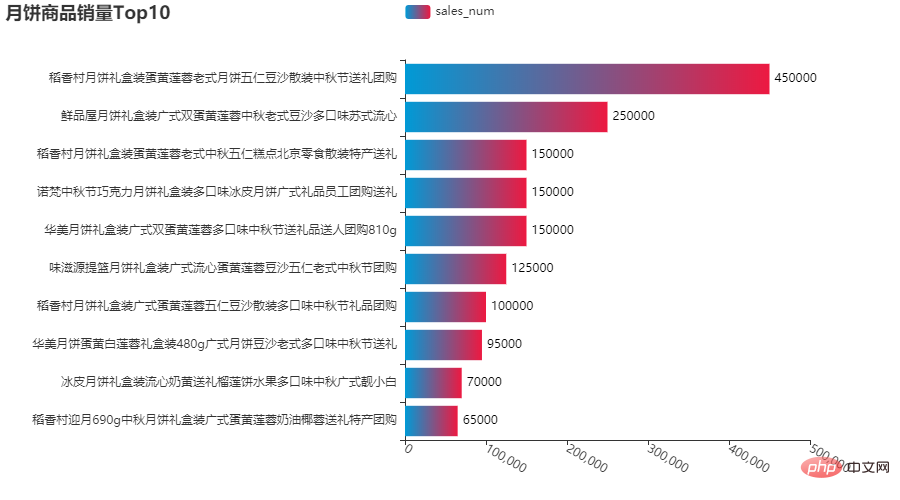
商品名称太长显示不全,我们调整一下边距:
bar1 = (
    Bar()
        .add_xaxis(shop_top10.index.tolist()[::-1])
        .add_yaxis('sales_num', shop_top10.values.tolist()[::-1],itemstyle_opts=opts.ItemStyleOpts(color=JsCode(color_js)))
        .reversal_axis()
        .set_global_opts(title_opts=opts.TitleOpts(title='月饼商品销量Top10'),
             xaxis_opts=opts.AxisOpts(axislabel_opts=opts.LabelOpts(rotate=-30)),
             )
        .set_series_opts(label_opts=opts.LabelOpts(position='right'))
)
# 将图形整体右移
grid = (
    Grid()
        .add(bar1, grid_opts=opts.GridOpts(pos_left='45%', pos_right='10%'))
)
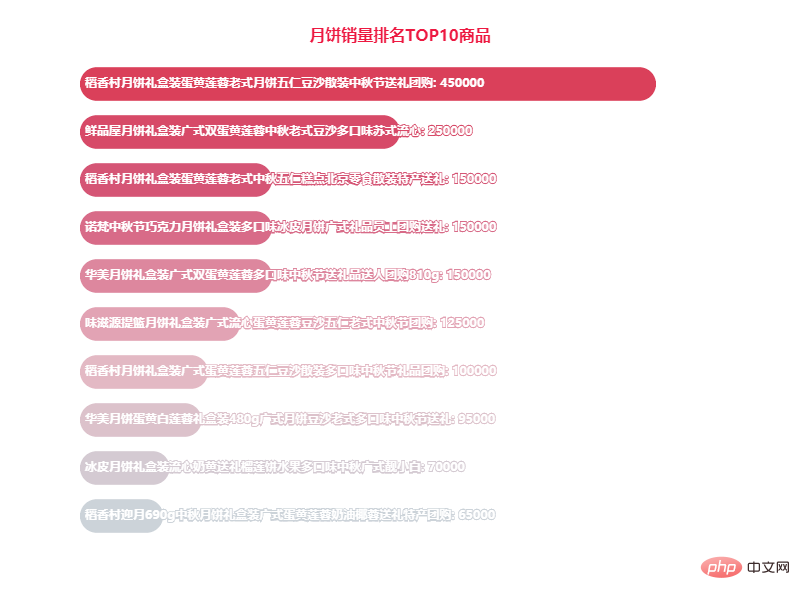
还可以来些其他(比如:形状)设置:
3.2 月饼销量排名TOP10店铺
代码:
shop_top10 = df.groupby('店铺名称')['销量'].sum().sort_values(ascending=False).head(10)
bar3 = (
    Bar(init_opts=opts.InitOpts(
        width='800px', height='600px',))
    .add_xaxis(shop_top10.index.tolist())
    .add_yaxis('', shop_top10.values.tolist(),
               category_gap='30%',
              )

    .set_global_opts(
        xaxis_opts=opts.AxisOpts(axislabel_opts=opts.LabelOpts(rotate=-30)),
        title_opts=opts.TitleOpts(
            title='月饼销量排名TOP10店铺',
            pos_left='center',
            pos_top='4%',
            title_textstyle_opts=opts.TextStyleOpts(
                color='#ed1941', font_size=16)
        ),
        visualmap_opts=opts.VisualMapOpts(
            is_show=False,
            max_=600000,
            range_color=["#CCD3D9", "#E6B6C2", "#D4587A","#FF69B4", "#DC364C"]
        ),
     )
)
bar3.render_notebook()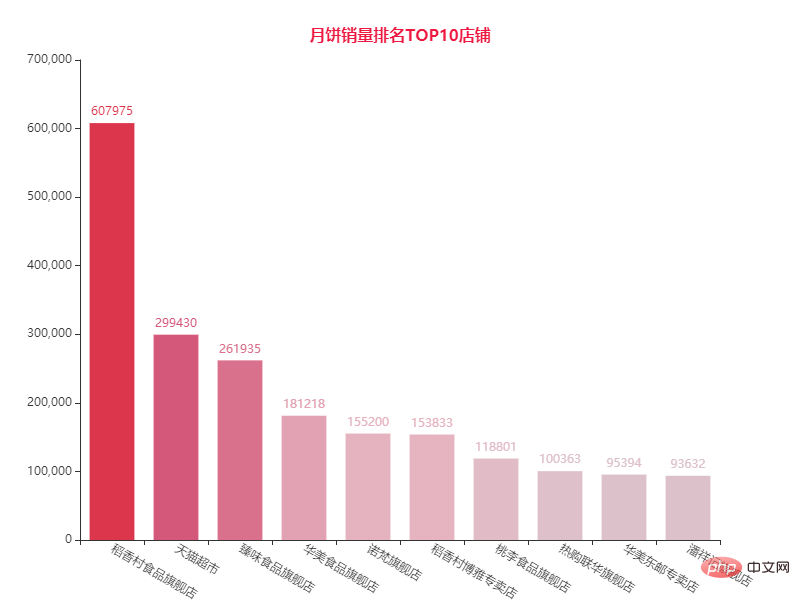
稻香村的月饼销量遥遥领先。
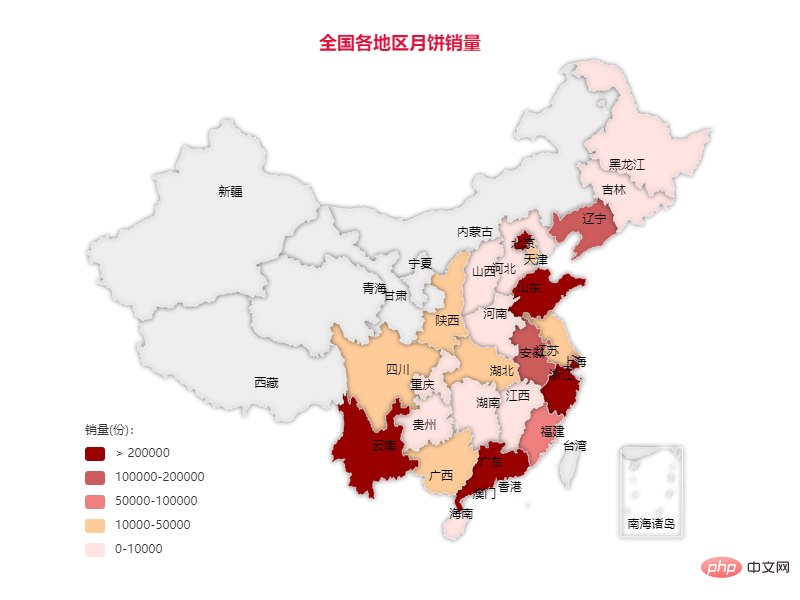
3.3 全国各地区月饼销量
province_num = df.groupby('省份')['销量'].sum().sort_values(ascending=False)
map_chart = Map(init_opts=opts.InitOpts(theme='light',
                                        width='800px',
                                        height='600px'))
map_chart.add('',
              [list(z) for z in zip(province_num.index.tolist(), province_num.values.tolist())],
              maptype='china',
              is_map_symbol_show=False,
              itemstyle_opts={
                  'normal': {
                      'shadowColor': 'rgba(0, 0, 0, .5)', # 阴影颜色
                      'shadowBlur': 5, # 阴影大小
                      'shadowOffsetY': 0, # Y轴方向阴影偏移
                      'shadowOffsetX': 0, # x轴方向阴影偏移
                      'borderColor': '#fff'
                  }
              }
              )
map_chart.set_global_opts(
    visualmap_opts=opts.VisualMapOpts(
        is_show=True,
        is_piecewise=True,
        min_ = 0,
        max_ = 1,
        split_number = 5,
        series_index=0,
        pos_top='70%',
        pos_left='10%',
        range_text=['销量(份):', ''],
        pieces=[
            {'max':2000000, 'min':200000, 'label':'> 200000', 'color': '#990000'},
            {'max':200000, 'min':100000, 'label':'100000-200000', 'color': '#CD5C5C'},
            {'max':100000, 'min':50000, 'label':'50000-100000', 'color': '#F08080'},
            {'max':50000, 'min':10000, 'label':'10000-50000', 'color': '#FFCC99'},
            {'max':10000, 'min':0, 'label':'0-10000', 'color': '#FFE4E1'},
           ],
    ),
    legend_opts=opts.LegendOpts(is_show=False),
    tooltip_opts=opts.TooltipOpts(
        is_show=True,
        trigger='item',
        formatter='{b}:{c}'
    ),
    title_opts=dict(
        text='全国各地区月饼销量',
        left='center',
        top='5%',
        textStyle=dict(
            color='#DC143C'))
)
map_chart.render_notebook()
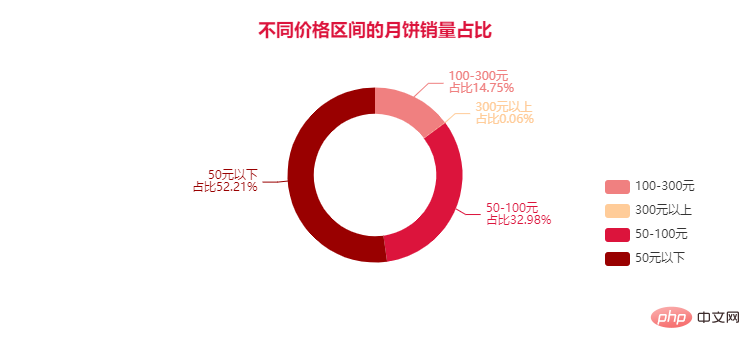
结果:

以上が視覚化 | Python が中秋の月餅を分析、これらの味が yyds です!の詳細内容です。詳細については、PHP 中国語 Web サイトの他の関連記事を参照してください。
声明:
この記事はPython当打之年で複製されています。侵害がある場合は、admin@php.cn までご連絡ください。

