ホームページ >バックエンド開発 >Python チュートリアル >Python と Matplotlib を使用してテキスト内に文字を描画する
Python と Matplotlib を使用してテキスト内に文字を描画する
- 王林転載
- 2023-04-29 19:31:051033ブラウズ
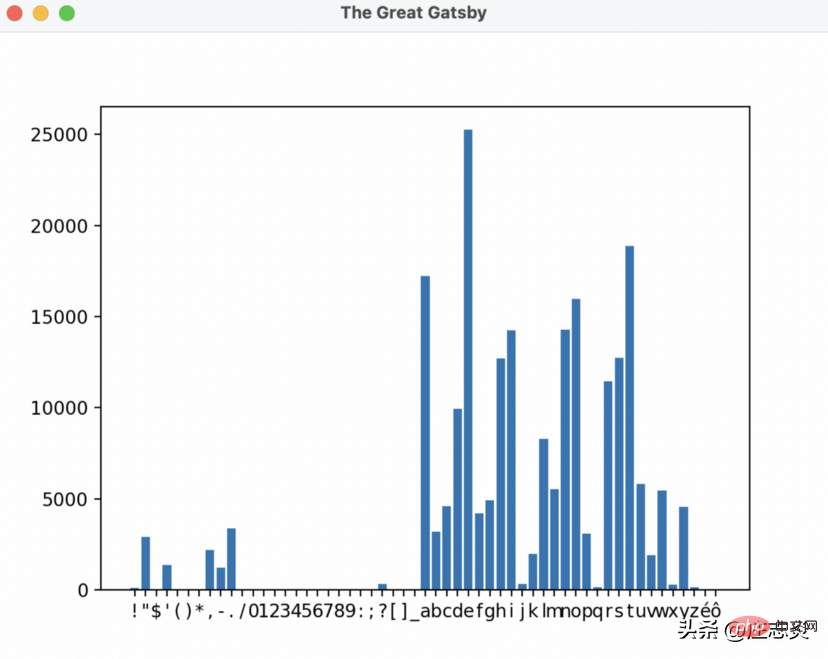
この記事の目的は、Python でデータのプロットを開始できるようにすることです。特定のテキスト ファイル内の文字の頻度をプロットする棒グラフを作成します。この場合、テキスト ファイルには『華麗なるギャツビー』のコンテンツが含まれています。

$ python3 -m venv venv
$ source venv/bin/activate
必要な依存関係をインストールできます
$ pip3 install matplotlibまた、read.txt と wordcount.py という 2 つのファイルも作成します。 wordcount.py を使用して read.txt 内のテキストを分析します。 ステップ 2: テキストを読む比較的簡単に始めることができます。
import matplotlib.pyplot as plt # plot
from collections import OrderedDict # this will be used for sorting later

file = open('read.txt')
text = file.read()
file.close()
- まず、描画および並べ替えライブラリをインポートします
- Secondでは、組み込みの open 関数を使用します。これにより、ファイルを開いて読み取りと書き込みを行うことができます。
- 次に、ファイル内のテキストを読み取り、テキスト変数に保存します。
- 最後に、もう使用しないのでファイルを閉じます
charDict = {} # dictionaries are defined by curly braces
def count_letter(character):
character = character.lower()
if character.isspace():
return
if character in charDict:
charDict[character] = charDict[character] + 1
else:
charDict[character] = 1

# loop through text
for i in text:
count_letter(i)

charDict = OrderedDict(sorted(charDict.items()))
ここで何が起こったのかを振り返ってみましょう。
- 最初に空の辞書を定義します
- 次に、def キーワードを使用して関数を定義します。この関数は変数「char」を受け取り、それがスペース (スペース、タブ、改行) であるかどうかを確認します。 isalpha() などの他の選択基準を追加して、文字が文字
- であるかどうかを判断し、それがすでに辞書に存在するかどうかを確認することができます。辞書にある場合は、値を前の値に 1 を加えた値に変更します (この文字をカウントしているため)。それ以外の場合は、初期カウント 1
- で新しいエントリを辞書に追加します。繰り返します。テキスト変数内の文字ごとに (「i」は個々の文字を表します)、関数を保存して実行してそれらをカウントします。
- 最後に、OrderdedDict インポートを使用して辞書をアルファベット順に並べ替えます
num_list = []これらのリストはそれぞれの軸に対応しますother なので、char_list の項目 1 が「a」の場合、num_list の項目 1 は対応する頻度になります。これもエンコードしてみましょう。char_list = []
char_list = [] # character
num_list = [] # frequency
# create x and y axes
for x,y in charDict.items():
char_list.append(x)
num_list.append(y)
2 つの変数を使用して、作成したディクショナリ内のキーと値のペアをループし、それらをデータ リストに追加します。 最後に、matplotlib を使用してこの棒グラフを作成して保存しましょう。
fig = plt.figure() # create a new figure
ax = fig.add_subplot() # create a new bar graph within the figure
fig.canvas.manager.set_window_title('The Great Gatsby') # title of window
ax.bar(char_list, num_list) # add the data to the graph
plt.savefig('chars.png') # download an image of the bar graph
plt.show() # show the image
- まず、新しい形状を作成します。画像はウィンドウ全体を示しています。
- 画像にプロットを追加します。
- 選択したデータを使用して棒グラフを追加します。
- 画像をダウンロードします。
- 画像を表示します。
rreeee

それでは、記事の冒頭で私が尋ねた質問に答えると、文字 e は『華麗なるギャツビー』の中で 25,000 回以上使用されています。おお!
結論
この記事の最後で、matplotlib とデータ サイエンスについて何かを学んでいただければ幸いです。
以上がPython と Matplotlib を使用してテキスト内に文字を描画するの詳細内容です。詳細については、PHP 中国語 Web サイトの他の関連記事を参照してください。
声明:
この記事は51cto.comで複製されています。侵害がある場合は、admin@php.cn までご連絡ください。

